Figures & data
Figure 1 The coronal (A) and axial (B) view of chest contrast-enhanced computed tomography showing dextrocardia and SIT.
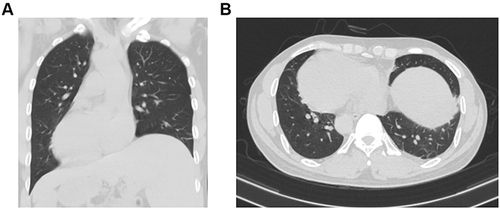
Figure 2 Computed tomography (CT) scans before stage I surgery. A giant mass (red arrow) measuring 7.1 × 5.5 × 5.6 cm in liver segments 8 was showed on CT scans. (A) plain scan; (B) arterial phase; (C) portal venous phase; (D) venous phase.
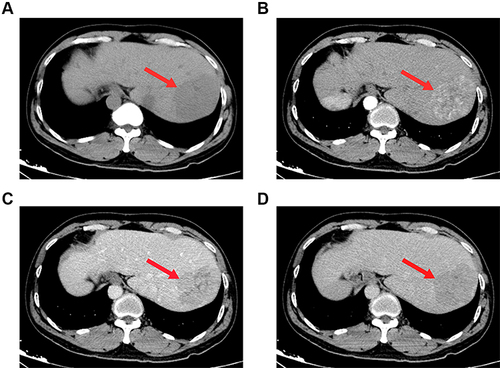
Figure 3 Magnetic resonance imaging showing a mass (red arrow) measuring 7.6 × 5.8 × 6.5 cm in segment VII and VIII of liver, (A) T1-weighted image; (B) T2-weighted image.
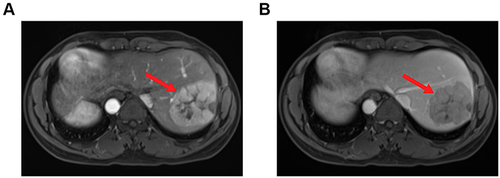
Figure 4 Intraoperative photographs during stage I surgery. (A) Selective isolation and ligation of the right portal vein (white arrow); (B) Ischemic line (white arrow) of the right liver.
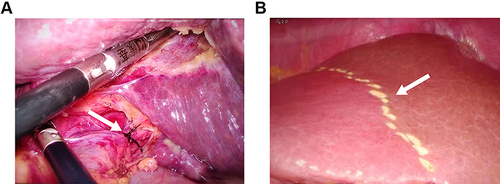
Figure 5 Computed tomography (CT) scans images after course, the focus was smaller than before, the tumor activity was still seen, and there was a little effusion in the operative area (red arrow). (A) Plain scan; (B) Arterial phase; (C) Portal venous phase; (D) Venous phase.
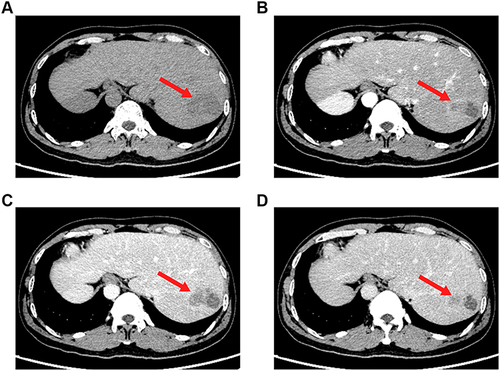
Figure 6 Dynamic changes in tumor marker levels during treatment process. The decrease of des-γ-carboxy prothrombin level reflects the reduction of tumor load. Alpha-fetoprotein was fair.
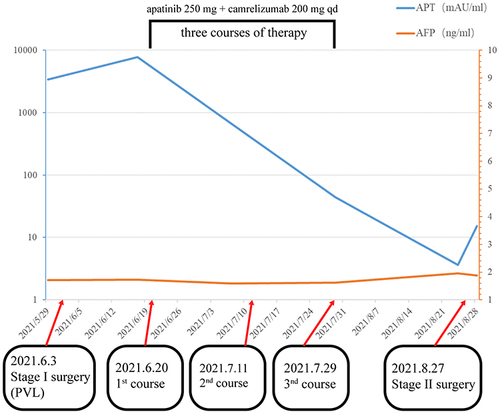
Figure 7 Computed tomography (CT) scans before stage II surgery. Reduce of tumor load (red arrow) was showed on CT scans. (A) plain scan; (B) arterial phase; (C) portal venous phase; (D) venous phase.
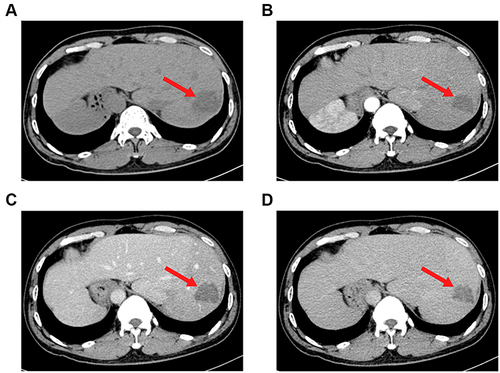
Figure 8 Magnetic resonance imaging showing a mass (red arrow) measuring 4.0×3.4 × 3.0 cm in segment VII and VIII of liver, (A) T1-weighted image; (B) T2-weighted image.
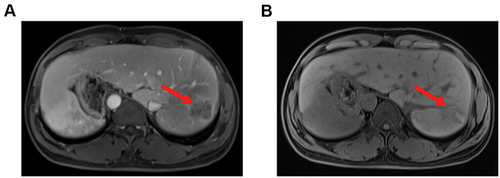
Figure 9 Intraoperative photographs during stage II surgery. (A) Ischemic line (white arrow) of the right live in stage I surgery; (B) Liver cross-section.
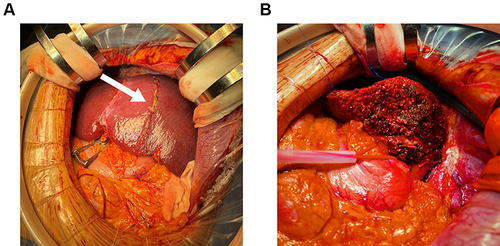
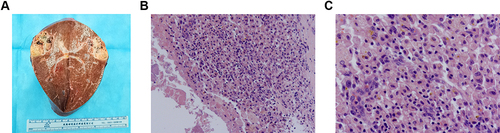
Figure 10 Surgical specimen and histopathological images. (A) The open resected specimen with liver tumor; (B and C) Pathological examination of tissue section; (B) 100 magnification; (C) 400 magnification.