Figures & data
Table 1 PGx Drugs with Their Corresponding Genes
Table 2 Characteristics of the Study Population
Table 3 Top 15 PGx Drugs Stratified by Prescribing Periods 2016–2020
Figure 1 Percentage of persons with PGx drug claims stratified by anatomical groups for the five-year period 2016–2020 and stratified by year. The anatomical groups are ranked by the proportion of persons with PGx drug claims in the 5-year period 2016–2020.
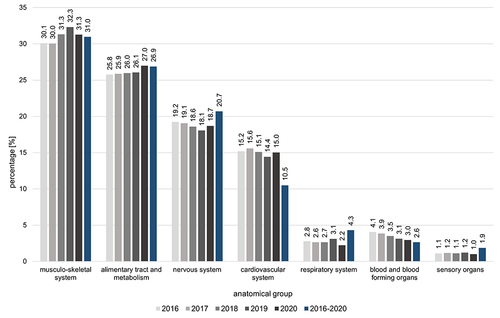
Table 4 Genes Associated with PGx Drugs
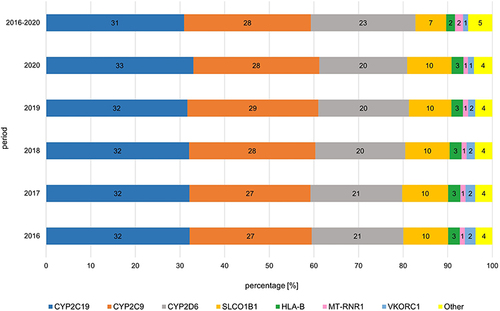
Figure 2 Proportion of all potential drug-gene interactions, stratified by prescribing periods 2016–2020. The potential drug-gene interactions are ranked by the highest proportion of all potential drug-gene interactions in the 5-year period 2016–2020. Other includes CYP3A4, CYP3A5, CACNA1S, RYR1, DPYD, HLA-A, TPMT, NUDT15, RARG, SLC8A3, UGT1A6, CYP2B6, IFNL3, UGT1A1, CFTR, G6PD, and CYP4F2.