Figures & data
Figure 1 CRYL1 expression is significantly lower in ccRCC tissue samples than in normal tissue samples. (A) Differential expression of CRYL1 in the TCGA cohort. (B) CRYL1 expression was downregulated in 12 of 14 ccRCC samples. (C) CRYL1 levels were significantly lower in ccRCC tissue samples in 12 of the 14 paired tissue samples. (D) CRYL1 expression levels in the pan-cancer dataset on the TIMER database (https://cistrome.shinyapps.io/timer/). (E) No significant differences in CRYL1 expression levels in ccRCC tissue samples between young and old patients. (F–L) CRYL1 expression levels are significantly different in patients with different genders, tumor status, pathological grades, tumor sizes, presence/absence of lymph node metastasis, presence/absence of metastasis, and tumor stage.
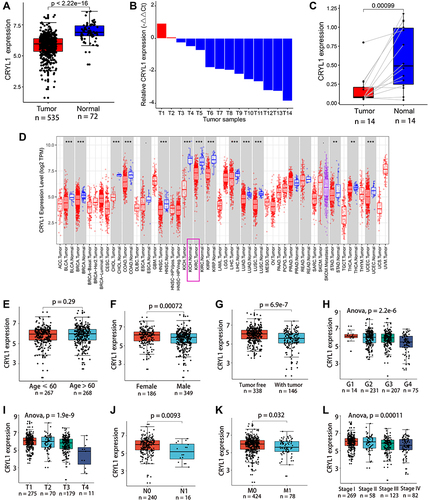
Figure 2 Prognostic value of CRYL1 in clear cell renal cell carcinoma. (A) CRYL1 expression levels were significantly negatively correlated with OS and DFS. (B) Validating the correlation between CRYL1 expression levels and OS and DFS on the GEPIA2 platform (http://gepia2.cancer-pku.cn/). (C) Prognostic value of CRYL1 expression in the pan-cancer dataset. (D and E) Univariate and multivariate Cox regression analyses of CRYL1 expression levels for OS. (F and G) Univariate and multivariate Cox regression analyses of CRYL1 expression levels for DFS.
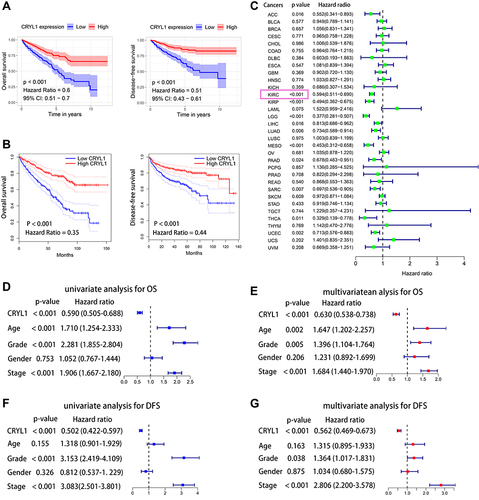
Figure 3 Stratified survival analysis of CRYL1 for overall survival (OS) and disease-free survival (DFS) according to histological grade and stage of ccRCC tumors. (A) Grade 1 or 2 and grade 3 or 4 for OS. (B) Stage I/II and stage III/IV for OS. (C) Grade 1 or 2 and grade 3 or 4 for DFS. (D) Stage I/II and stage III/IV for DFS.
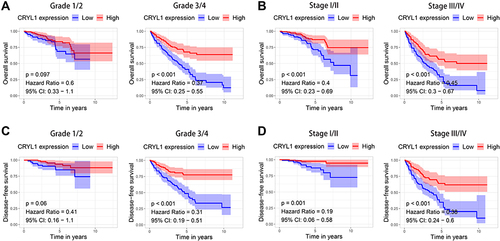
Figure 4 The correlation between CRYL1 expression levels and the immune microenvironment. (A) Significant negative correlations exist between CRYL1 expression levels and immune and stromal scores. (B) Correlation between CRYL1 expression levels and the numbers of immune cells.
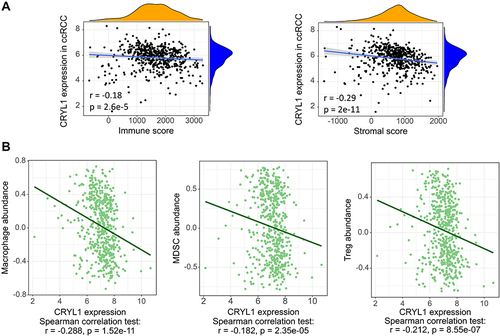
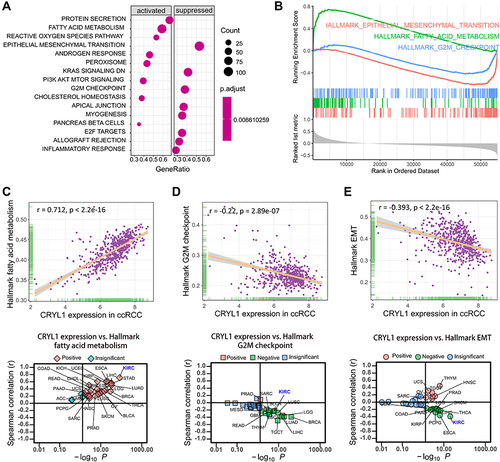
Figure 5 Results of gene set enrichment analysis (GSEA). (A) The activated and suppressed signaling pathway hallmarks in ccRCC with increased CRYL1 expression. (B) Enrichment plot showing three selected representative pathways. (C) Significant correlations between CRYL1 expression levels and hallmark fatty acid metabolism in the ccRCC and pan-cancer datasets. (D) Significant correlations between CRYL1 expression levels and the hallmark G2M checkpoint in the ccRCC and pan-cancer datasets. (E) Significant correlations between CRYL1 expression levels and hallmark EMT in ccRCC and pan-cancer datasets.