Figures & data
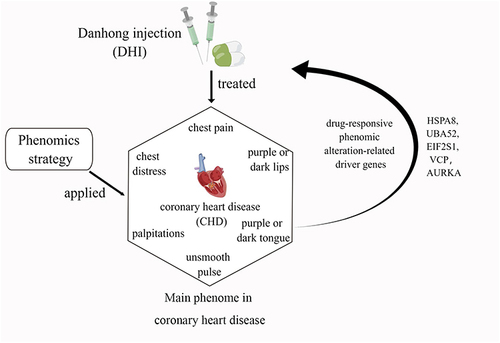
Table 1 Baseline Characteristics Between the Two Groups from the Selected Population
Figure 1 Changes of the XYZ phenome in CHD patients after Danhong injections. (a) On day 14 vs day 0, all XYZ phenome symptoms were improved except for unsmooth pulse (p < 0.01). (b) On day 30 vs day 0, all XYZ phenome symptoms were improved except for unsmooth pulse (p < 0.01). (c) Heatmap of correlation coefficients between symptoms and XYZ.
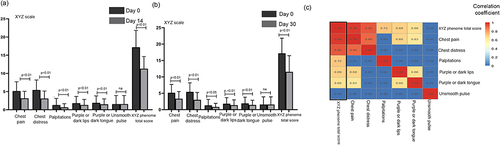
Table 2 Top ten Genes That Significantly Related to Each XYZ Symptom and XYZ Phenome (P<0.05)
Figure 2 Molecular mechanism of the improvement in the XYZ phenome in patients with CHD after treatment with Danhong injections. (a) Number of PARGs in the XYZ phenome and its component symptoms. (b) Comparison of genes, pathways, and GO biological processes between the day 14 and day 30. (c) Relationship between the involved pathways and the alterations in the XYZ phenome at day 14 and day 30.
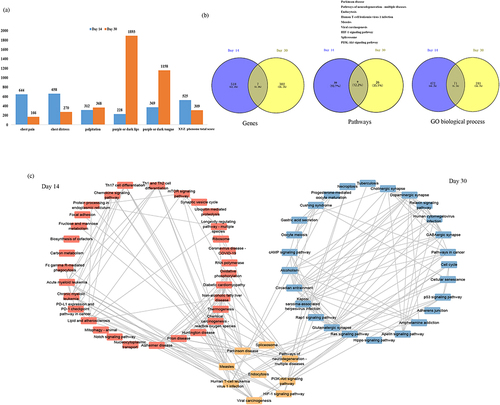
Figure 3 The overlapping KEGG pathways in patients treated with Danhong injections between the day 14 and day 30. (a) PI3K-Akt signaling pathway; (b) endocytosis; and (c) HIF-1 signaling pathway. The gene highlighted in red represents the day 14 and the gene highlighted in blue represents the day 30.
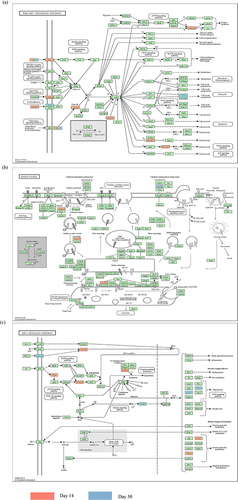
Figure 4 The internal genetic relationship of the symptoms of the XYZ phenome. (a and c) The common PARGs and pathways among five component symptoms at day 14; (b and d) the common PARGs and pathways among five component symptoms at day 30; (e and g) comparison of PARGs and pathways between five component symptoms with XYZ phenome at day 14; (f and h) comparison of PARGs and pathways between five component symptoms with XYZ phenome at day 30.
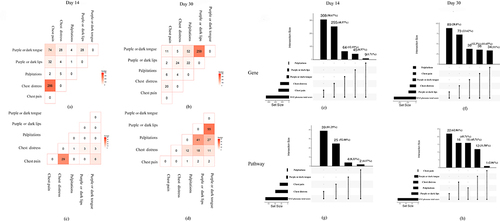
Figure 5 The internal relationship among the XYZ phenome, internal symptoms, and involved pathways. Day 14 is marked in red and day 30 is marked in blue. The red font indicates the pathways associated with the XYZ phenome.
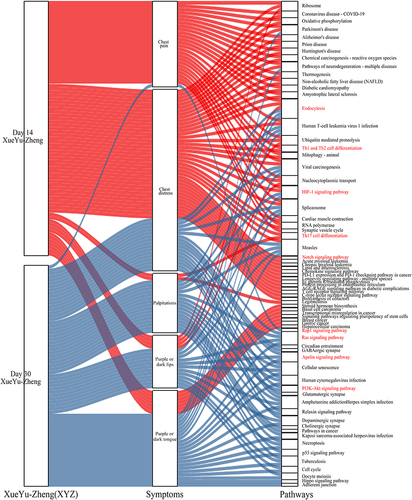
Figure 6 The PPI network of PARGs. (a) The PPI network of 189 PARGs. (b) The sub-PPI network at day 14. (c) The sub-PPI network at day 30.
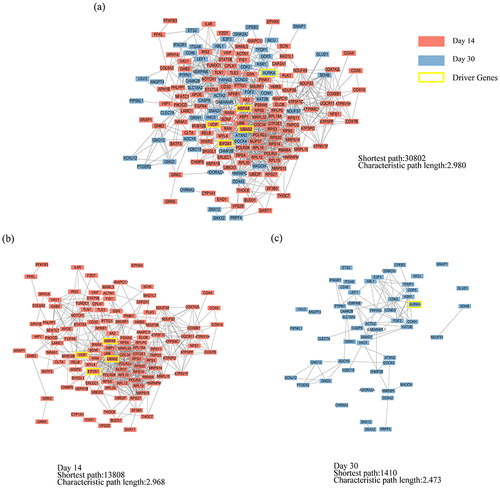
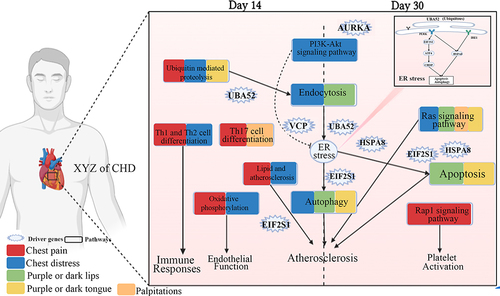
Figure 7 Symptoms, pathways, and GO biological processes related to driver genes. The red and blue bars in the middle of the graph represent the day 14 and day 30, respectively. The different colored lines indicate the different genes associated with symptoms, pathways, and GO biological processes. The black font indicates the pathway name, and the blue font indicates the GO biological process.
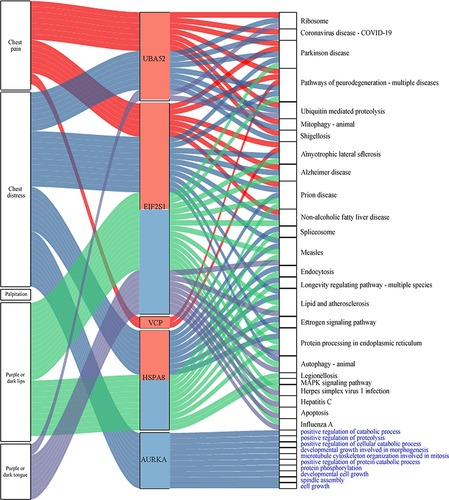
Figure 8 Validation of driver gene controllability. (a) The correlation coefficients between the driver genes and phenomic changes in the Danhong injection group and the control group, **p<0.01, *p<0.05. (b) The degree centrality, betweenness centrality, and closeness centrality of the driver genes. (c) The changes in the characteristic path length and the number of shortest paths for the PPI network of the PARGs with sequential deletion of driver genes.
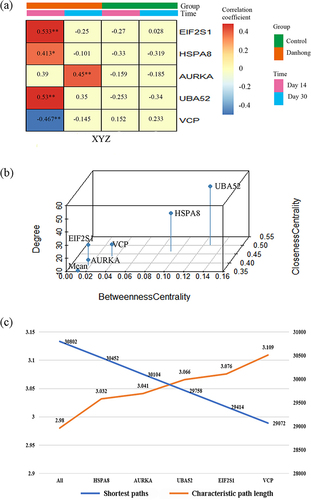
Figure 9 Molecular mechanism of the phenomic alterations in XYZ in patients with CHD treated with Danhong injections from the day 14 to day 30. Created with BioRender.com.