Figures & data
Figure 1 GABRP expression levels in human cancers. (A) Abnormal expression of GABRP in human cancers based on TCGA databases. (B) The expression of GABRP in LUSC (B and C) and LUAD (D). Abnormal expression of GABRP in lung cancer based on GSE1037 (E) and GSE43458 (F). Light blue indicates normal group, red indicates tumor group. (G) Protein levels of GABRP in normal lung tissue: https://www.proteinatlas.org/ENSG00000094755-GABRP/tissue/lung#img. Staining: low, intensity: moderate, quantity: < 25%. (H) Protein levels of GABRP in tumor tissue: https://www.proteinatlas.org/ENSG00000094755-GABRP/pathology/lung+cancer#img, Staining: medium, intensity: moderate, quantity: > 75%. *p < 0.05, **p < 0.01 and ***p < 0.001; ns indicates no significant difference.
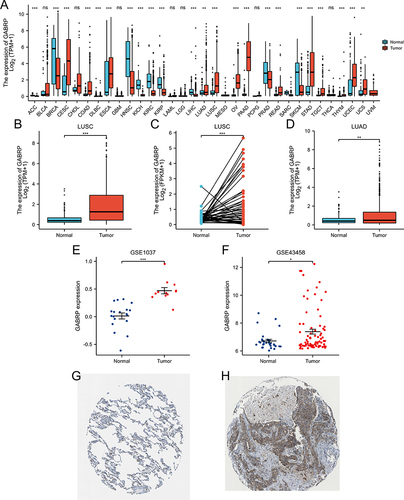
Table 1 Correlation Analysis Between GABRP Expression and Pathological Features of LUSC Patients
Table 2 Univariate and Multivariate Analyses Were Used to Explore the Prognostic Value of GABRP in LUSC Patients
Figure 2 High GABRP expression was associated with poor OS in LUSC patients. The Kaplan-Meier survival curves of the LUSC patients based on GEPIA (A) and TCGA (B) databases. (C) ROC curve analysis of GABRP expression in LUSC.
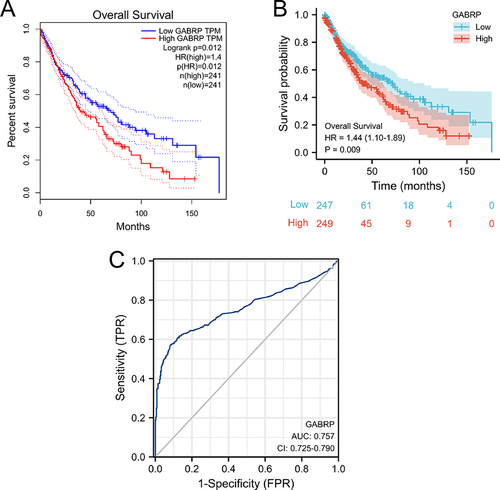
Figure 3 Establishment of a nomogram for LUSC patients. (A) A nomogram for assessing the survival probability of 1-year, 3-year, and 5-year for LUSC. (B) Calibration curve of the prognostic risk model.
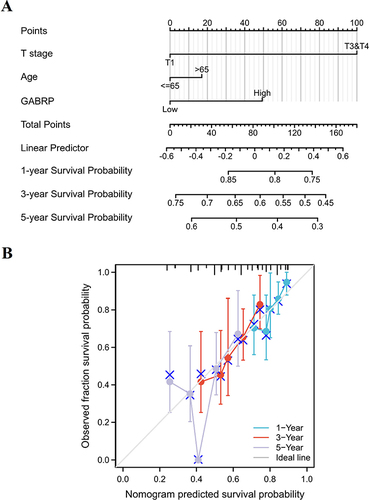
Figure 4 Identification and functional enrichment analysis of the GABRP-related DEGs in LUSC. (A) Volcano plots of the DEGs. (B) Co-expression heatmap of top DEGs. (C) GO and KEGG enrichment analyses of GABRP-related DEGs in LUSC. ***p < 0.001.
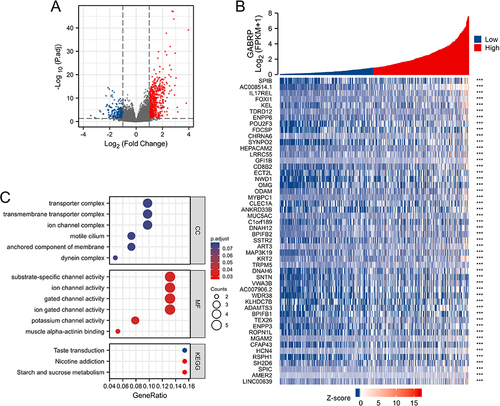
Figure 5 The relationship between GABRP expression and stromal score, immune score, and ESTIMATE score. (A) Box diagram presented the stromal score, immune score and ESTIMATE score in the low- and high-GABRP groups. Scatter plots presented the correlation between GABRP expression and stromal score (B), immune score (C) and ESTIMATE score (D) level. **p < 0.01, ***p < 0.001.
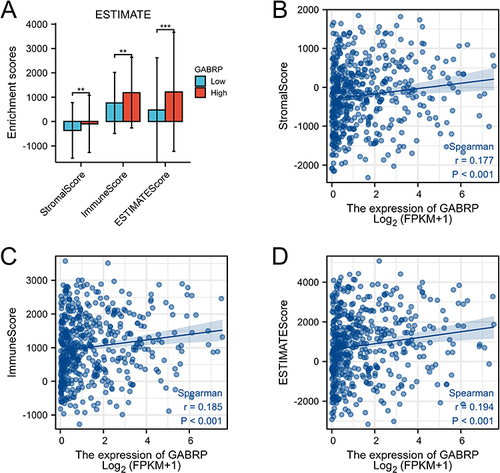
Figure 6 The relationship between GABRP expression and immune cell infiltrations. (A) Box diagram presented the enrichment scores of 24 immune cell types in the low- and high-GABRP groups. (B) Lollipop plot presented the correlation between GABRP expression and immune cells. Scatter plots presented the correlation between GABRP expression and aDC (C), NK cells (D) and TFH (E) level. *p < 0.05, **p < 0.01, ***p < 0.001; ns indicates no significant difference.
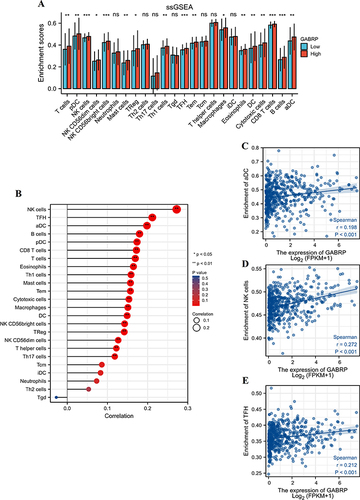
Figure 7 Correlation analysis of GABRP expression with immune checkpoint genes expression in LUSC. Scatter plots presented the correlation between GABRP expression and CD247 (A), CTLA4 (B), HAVCR2 (C), TIGIT (D), LAG3 (E), and PDCD1 (F) expression.
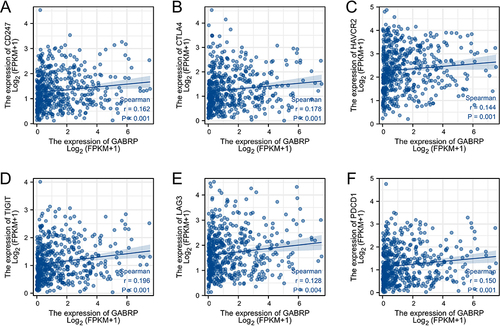
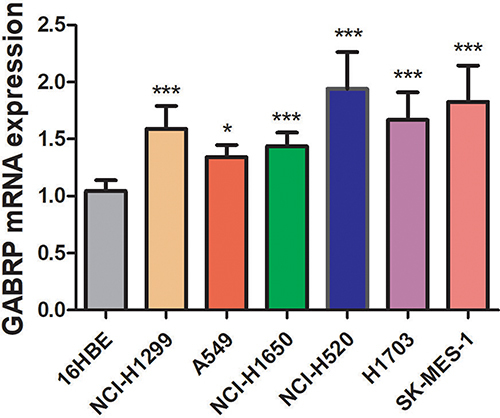
Figure 8 Expression of GABRP in lung cancer (NCI-H1299, NCI-H1650, A549, NCI-H520, H1703, and SK-MES-1) and 16HBE cell lines. The gene expression level was measured by qRT-PCR. *p < 0.05, **p < 0.01 and ***p < 0.001.