Figures & data
Table 1 Demographic and Clinical Information About Participants
Table 2 The Basic Information About Selected SNPs
Table 3 The Overall Association Analysis of TREM1 Variants with Glioma Susceptibility in Genetic Models
Figure 1 Overall analyses for the association between TREM1 variants and glioma susceptibility.
Abbreviations: CI, Confidence interval; OR, Odds ratio.
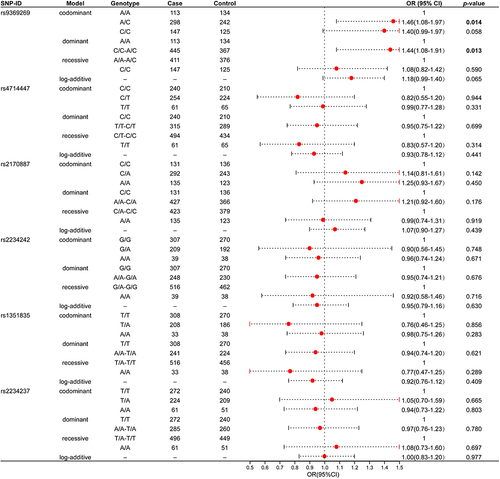
Table 4 The Association Between rs9369269 and rs4714447 and Glioma Susceptibility After Age- and Gender-Stratified Analyses
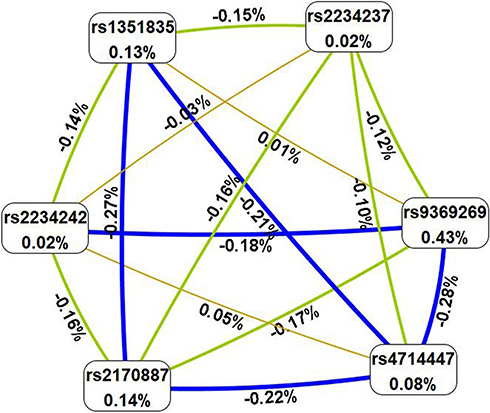
Figure 2 Multifactor dimensionality reduction (MDR) was completed to assess the interaction among SNPs in TREM1 to predict glioma risk.