Figures & data
Figure 1 Identification of differential and prognostic genes of PUS enzymes. (A and B) Heatmap is displayed for the differential expression of PUS enzymes in TCGA and ICGC cohort. (C and D) Forest plot for univariate cox regression analysis of PUS enzymes in TCGA and ICGC cohort. (E) Boxplot of PUS1 based on TCGA and GTEx data in GEPIA. (F) Boxplot of PUS1 based on TCGA data in GEPIA. (G and H) Survival plots of PUS1 for OS and DFS in GEPIA. *p<0.05, **p<0.01, ***p<0.001.
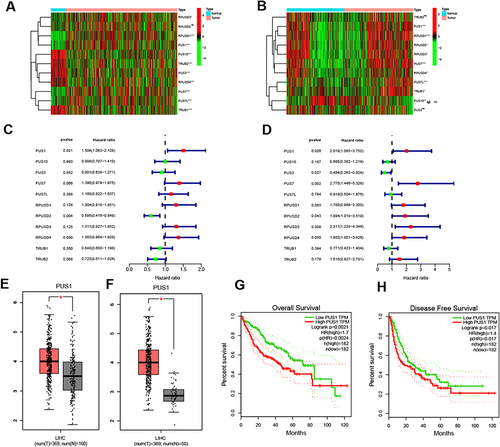
Figure 2 Differential expressions analysis and diagnostic receiver operator curves of PUS1. (A–D) Scatter plots of PUS1 in TCGA, ICGC, GSE14520 and Guangxi cohorts. (E–H) Diagnostic receiver operator curves of PUS1 in TCGA, ICGC, GSE14520 and Guangxi cohorts. (I–O) Box plot shown the significant clinical characteristics for differential expressions analysis of PUS1 in TCGA, ICGC and GSE14520 cohorts. *p<0.05, **p<0.01, ***p<0.001, ****p<0.0001.
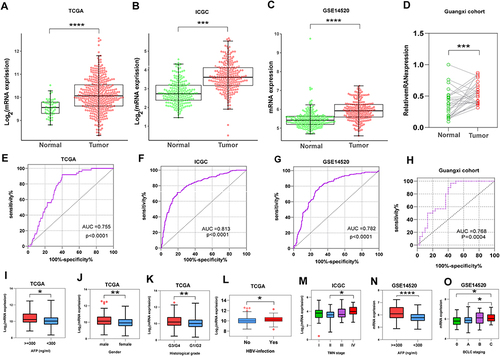
Figure 3 Prognostic OS analysis of PUS1. (A, D and G) Kaplan-Meier plots of PUS1 in TCGA, ICGC, and GSE14520 cohorts. (B, E and H) Forest plots for cox proportional hazards regression model of PUS1 in TCGA, ICGC, and GSE14520 cohorts. (C, F and I) Prognostic receiver operator curves of PUS1 and significant clinical characteristics TCGA, ICGC, and GSE14520 cohorts. *p<0.05, **p<0.01, ***p<0.001.
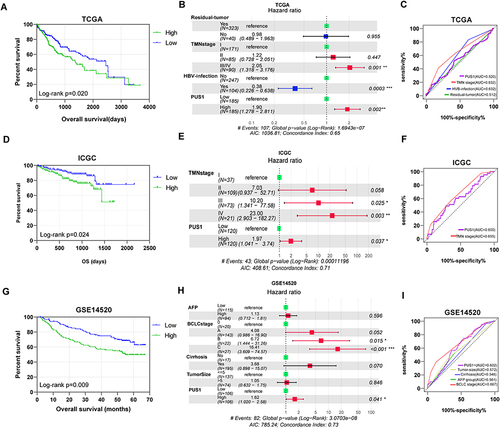
Figure 4 Prognostic RFS analysis of PUS1. (A and B) Kaplan-Meier plots of PUS1 in TCGA and GSE14520 cohorts. (D and F) Kaplan-Meier plots and receiver operator curves of PUS1 for 1 year- RFS in TCGA cohort. (C and E) Kaplan-Meier plots and receiver operator curves of PUS1 for 1 year- RFS in GSE14520 cohort.
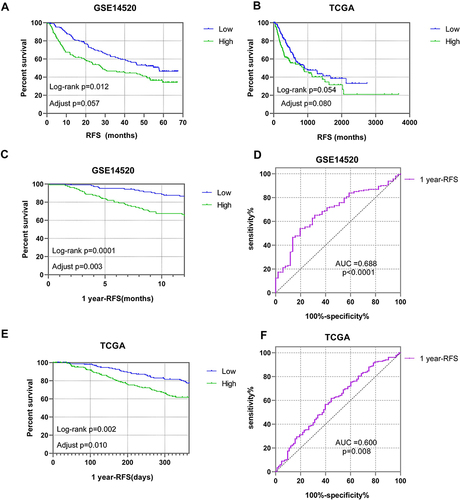
Figure 5 Joint-effect analysis of PUS1 and significant clinical variables. (A–F) Kaplan-Meier plots of joint-effect analysis for OS in GSE14520, TCGA and ICGC cohorts. (G–I) Kaplan-Meier plots of joint-effect analysis for 1 year- RFS in GSE14520 and TCGA cohorts.
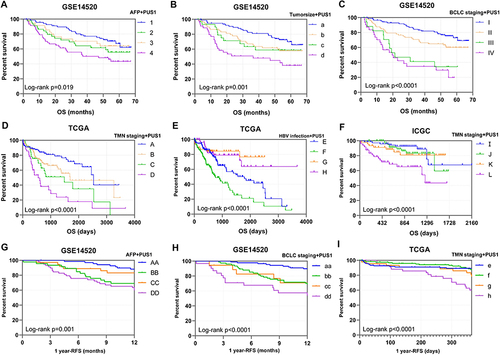
Figure 6 Predictive signature of PUS1 for prognosis. (A) A nomogram of PUS1 and prognosis related variables for predicting 1-, 3- and 5-year events (death) in GSE14520 cohort. (B) A risk model of PUS1 in GSE14520 cohort.
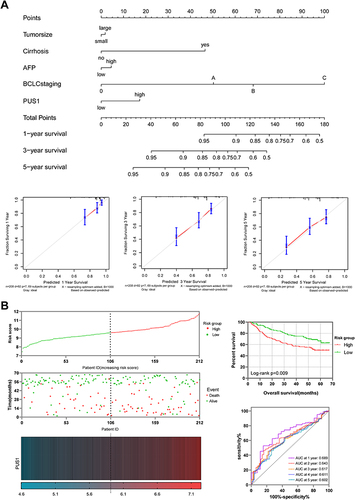
Figure 7 Functional enrichment analysis of PUS1 co-expression genes and differential genes. (A and B) Regulatory network of PUS1 co-expressed genes for several important GO terms and KEGG pathways in TCGA and GSE14520 cohorts. (C and D) Histogram for functional enrichment analyses of PUS1 co-expressed genes in DAVID using TCGA and GSE14520 cohorts. (E and F) Chord plots for functional enrichment analyses of PUS1 differential genes in DAVID using TCGA and GSE14520 cohorts.
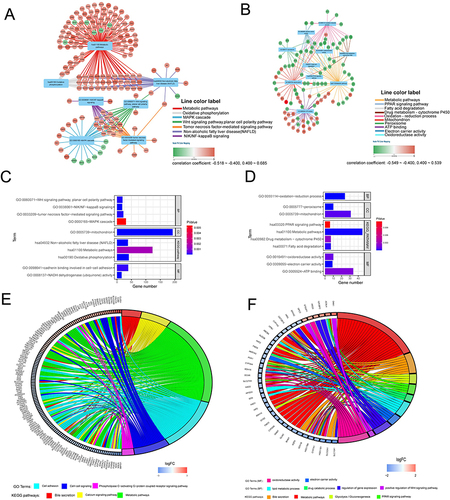
Figure 8 Gene set enrichment analysis of PUS1 using TCGA data. A, F: Results of c5-reference gene sets for high expression group of PUS1. G, L: Results of c2-reference gene sets for high expression group of PUS1.
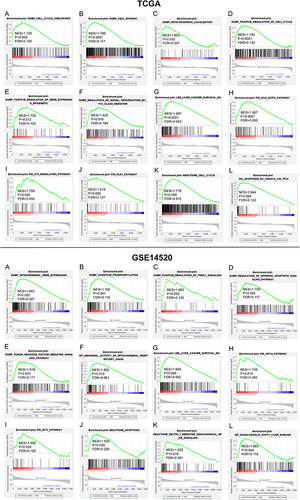
Figure 9 Validation of knockdown efficiency of PUS1. (A and B) Results of PCR after knock-downing PUS1 in Huh-7 and Hep3B cells. (C and D) Results of WB after knock-downing PUS1 in Huh-7 and Hep3B cells. (E and F) Histogram displaying the results of WB.
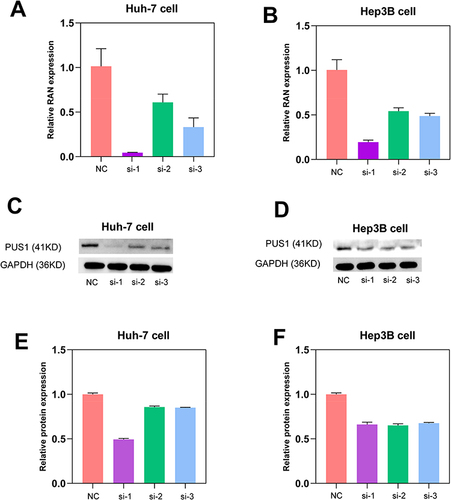
Figure 10 Results of cell migration, invasion, proliferation and ROS level assays. (A) Images under microscope and statistical comparison of transwell migration and invasion assays in Hep3B and Huh-7 cells. (B) Results of cell proliferation assays of Hep3B and Huh-7 cells. (C) Histogram comparing ROS level of NC and si-1 group in Hep3B and Huh-7 cells. *p<0.05, **p<0.01, ***p<0.001, #Not significant.
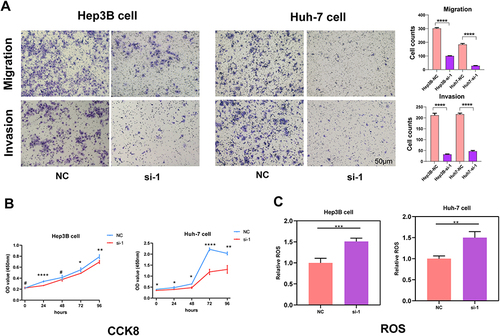
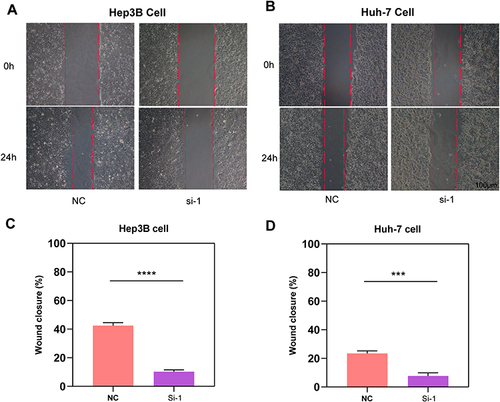
Figure 11 Results of wound-healing assays. (A and B) Results of wound-healing assays of Hep3B and Huh-7 cells under microscope. (C and D) Histogram comparing the results of wound-healing assays. ***p<0.001, ****p<0.0001.