Figures & data
Figure 1 (A) Volcano map of DEGs in GSE87466 and GSE179285, red dots represent the upregulated genes and the green dots represent the downregulated genes; (B) Heat map of DEGs.
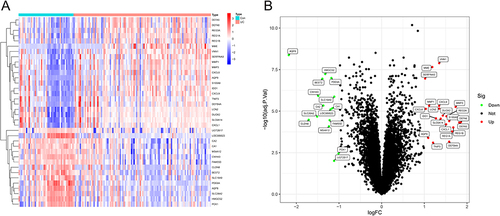
Figure 2 (A) Results of GO enrichment analysis; (B) results of KEGG enrichment analysis; (C) results of DO analysis; (D) GSEA analysis results displaying the top 5 signaling pathways.
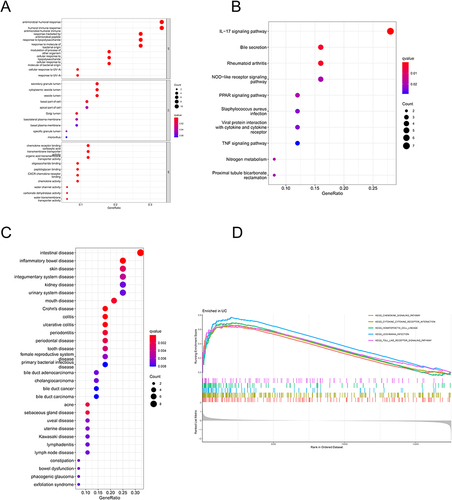
Figure 3 (A) LASSO logistic regression algorithm used to analyze the feature genes; (B) SVM-RFE algorithm used to analyze the feature genes; (C) Venn diagram of the intersection of two sets of feature genes.
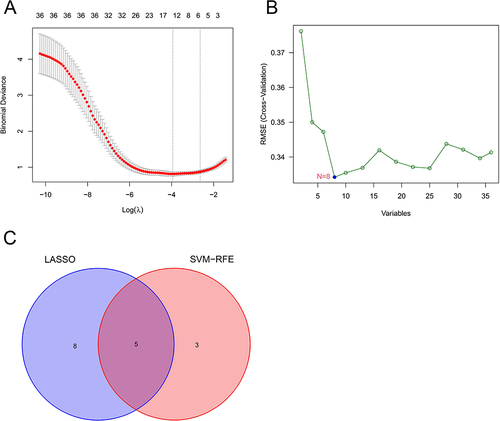
Figure 4 ROC analysis of AQP8 (A), HMGCS2 (B), VNN1 (C), and MME (D) in GSE75214.
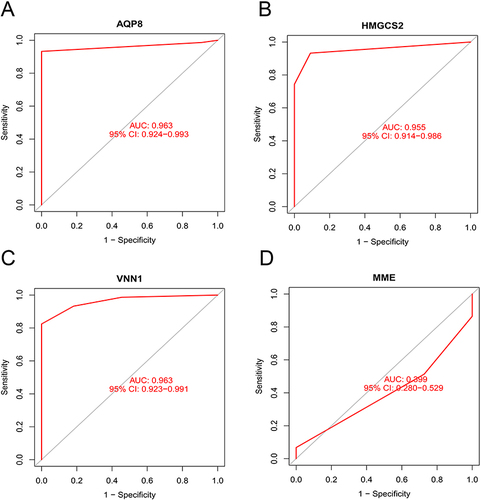
Figure 5 The validation results of AQP8 (A), HMGCS2 (B), VNN1 (C), and MME (D) in GSE75214.
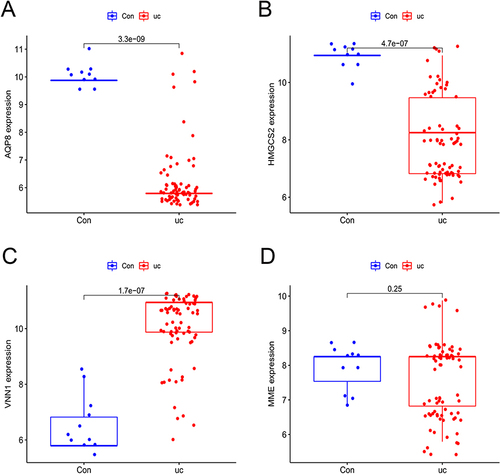
Figure 6 (A) Results of immune cell infiltration in the colon of UC patients and normal subjects; (B) heat map of the correlation of 22 immune cell species in UC; (C) the violin plot of the ratio of 22 immune cell species.
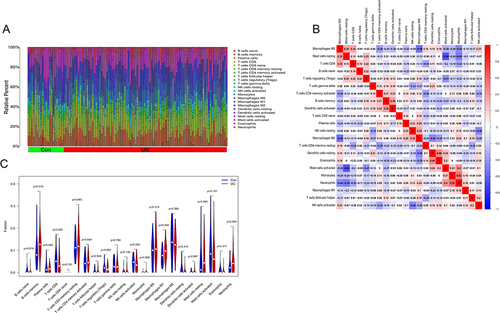
Figure 7 Correlation among AQP8 (A), HMGCS2 (B), VNN1 (C), and infiltrating immune cells.
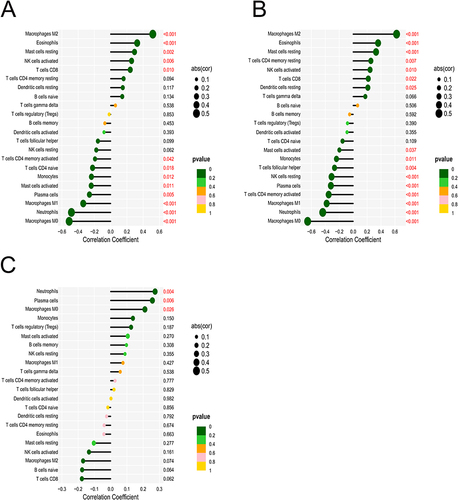
Figure 8 Expression of AQP8 (A), HMGCS2 (B), and VNN1 (C) and TNF-α (D) mRNA in UC mice. *P<0.05, **P<0.01, ***P<0.001.
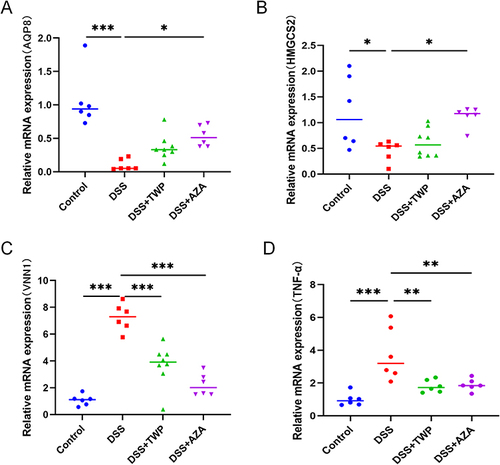
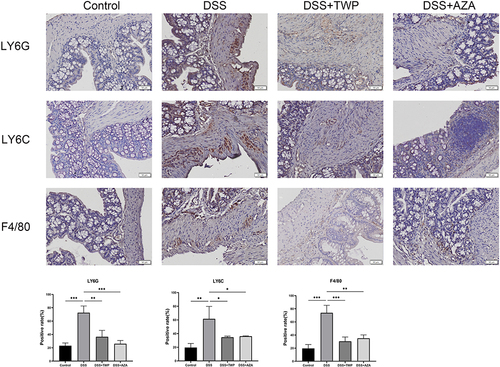
Figure 9 Expression of Ly6G, Ly6C and F4/80 in mouse colon. Scale bar: 50μm. Each data represents at least three independent experiments. *P<0.05, **P<0.01, ***P<0.001.