
Figures & data
Table 1 Demographic Characteristic of the Cases with Stroke and Controls
Table 2 Basic Information About SNPs and Association with Risk of Stroke in Allele Model
Table 3 Genetic Model Analyses of the Association Between Three SNPs and the Risk of Stroke (Adjusted by Age and Gender)
Table 4 Distribution of SNPs in Different Age, Gender, Smoking Status, Drinking Status and Its Association with Risk of Stroke
Table 5 Summary of SNP-SNP Interactions on the Risk of Stroke Analyzed by MDR Method
Figure 1 Dendrogram about the analysis of SNP-SNP interactions. Colors in the dendrogram indicate synergies or redundancies. Red indicates a high degree of synergistic interaction; Orange indicates a lesser degree, whereas brown represents the midpoint; blue represents the highest level of redundancy, followed by green. The shorter the distance between nodes, the stronger the interaction between them.
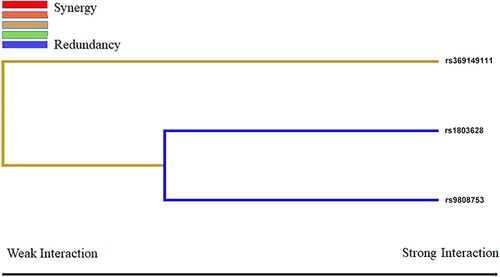
Table 6 Clinical Characteristics of Stroke Patients Based on the Genotypes of Selected SNPs