
Figures & data
Table 1 Basic Characteristics of the Study Population
Figure 1 Comparison of serum concentrations of biomarkers among the HCs, DEWs and CWPs groups. (A) Osteopontin; (B) KL-6; (C) Syndecan-4; (D) Gremlin-1; (E) Osteopontin; (F) KL-6; (G) Syndecan-4; (H) Gremlin-1. *Compared with HCs, p < 0.05; #Compared with DEWs, p < 0.05. p value was computed by Kruskal–Wallis test among different stage of CWPs in Osteopontin, KL-6, Syndecan-4 and Gremlin-1. p >0.05. Bars represent median with interquartile 25–75, min-maximum.
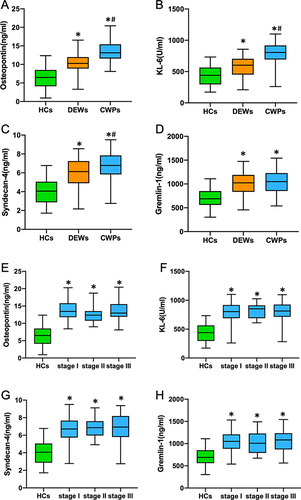
Figure 2 (A) Correlations among Osteopontin, KL-6, Gremlin-1 and Syndecan-4 in all participants. (B) Correlations between Osteopontin, KL-6, Gremlin-1, and Syndecan-4 and pulmonary function parameters in all participants. The numbers represent the value of Pearson coefficient.
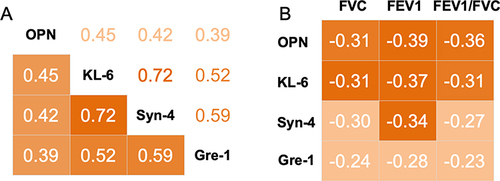
Table 2 Correlations Between Biomarkers and Pulmonary Function Among All Participants
Table 3 The Association Between Serum Biomarkers and CWP by Univariate and Multivariate Analysis
Table 4 Cut-Off Values and the Identifying Ability of Osteopontin, KL-6, Syndecan-4, and Gremlin-1 by ROC Curve Analysis
Figure 3 (A) ROC curve analysis to differentiate patients with CWP from HCs. (B) ROC curve analysis to differentiate patients with CWP from DEWs. (C) Combined ROC curve analysis to differentiate patients with CWP from HCs. (D) Combined ROC curve analysis to differentiate patients with CWP from DEWs. a+b: combined Osteopontin and KL-6; a+c: combined Osteopontin and Syndecan-4; b+c: combined KL-6 and Syndecan-4; a+b+c: combined Osteopontin, KL-6 and Syndecan-4. a: Osteopontin; b: KL-6; c: Syndecan-4.
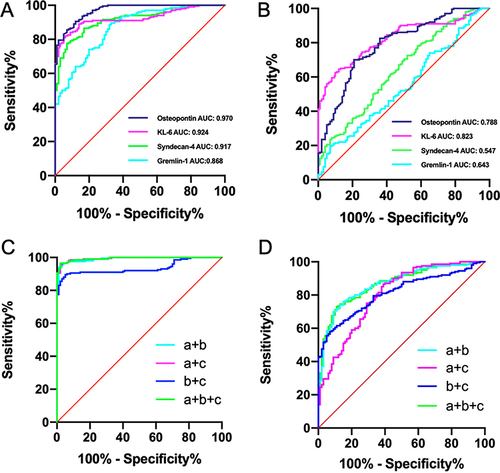
Table 5 Cut-Off Values and the Identifying Ability of Combined Osteopontin, KL-6, and Syndecan-4 by ROC Curve Analysis