Figures & data
Figure 1 Number of requests in the period 2017–2021.
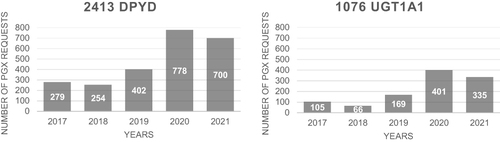
Figure 2 (A) The pink square line represents the melting profile of the sample B.M. (Tm allele 1: 52°C; Tm allele 2: 58.5°C). The melting profile of the heterozygous control is represented by the light-blue solid line (Tm allele T: 58.5°C; Tm allele G: 51°C) and the melting profile of the wild-type (WT) control is represented by the pink solid line (Tm allele T: 58.5°C). (B) TaqMan assay on second extraction detects only the reference allele T in the sample B.M.*, as in the control WT§; the heterozygous control^ has both alleles. (C) The sequence shows a T>G substitution (red rectangle) four bases before the position of c.1679, indicated by the row.
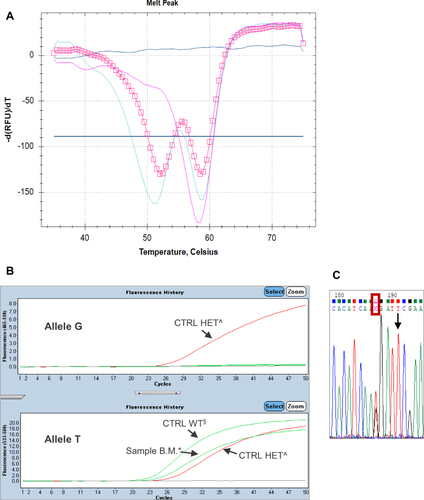
Figure 3 (A) DPYD*2A genotyping: the pink circle line represents an abnormal melting profile of that sample, compared to the others with GG genotype (wild-type samples, represented by single blue peaks). The double blue peak represents the heterozygous control (Tm allele G: 50.5°C; Tm allele A: 56.5°C). (B) The melting profile of the sample A.R.* confirms the presence of the variant close to the DPYD*2A, c.1896T>C in heterozygosity (the double green peaks, one of the sample A.R. and the other one of the heterozygous control, are completely overlapped; Tm allele T: 62.2°C and Tm allele C: 68.2°C). The wild-type control^ is represented by the single red peak (Tm allele T: 62.2°C).
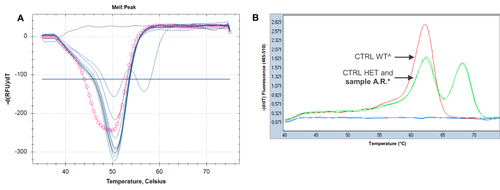
Figure 4 (A) The star line represents the melting profile of the sample C.L. (Tm allele 1: 53.2°C; Tm allele 2: 62.8°C). Instead, the solid line represents the double peak of the c.496A>G heterozygous control (Tm allele G: 58°C; Tm allele A: 63.3°C). (B) TaqMan assay on second extraction shows an amplification plot (red dash line) in-between the wild-type (blue solid line) and heterozygous (red solid line) controls. The green solid line represents the mutated control. (C) The sequence shows a T>C substitution (red rectangle) one base after the position of c.496A>G, indicated by the row, also in heterozygosity.
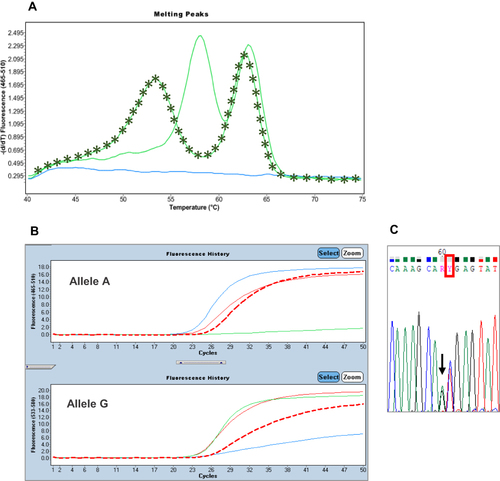
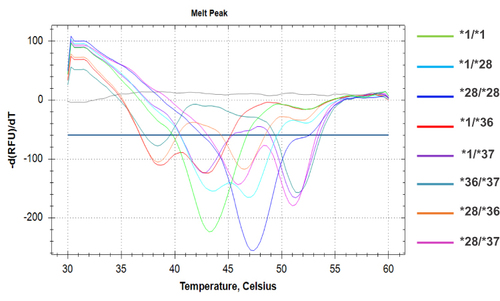
Figure 5 A distinctive melting profile is obtained for each different genotype of the UGT1A1 (TA)n polymorphism. On the right of the chromatogram, lines of different colours are listed, corresponding to the different genotypes. The melting temperatures of each allele are: 43.5°C±1 for the wild-type *1 allele; 47°C±1 for the *28 mutated allele; 39°C±1 for the *36 allele and 51.5°C±1 for the *37 allele.