Figures & data
Table 1 Correlations Between Hsa_circ_0003489 Levels and NSCLC Patient Clinicopathological Features
Figure 1 Expression of hsa_circ_0003489 in PTX-resistant NSCLC tissues and cell lines. (A) The expression of hsa_circ_0003489 in PTX-sensitive and PTX-resistant NSCLC tissues; qRT-PCR assay. (B) The expression of hsa_circ_0003489 in HBE, A549, H460, A549/PTX, and H460/PTX cells; qRT-PCR assay. (C) IC50 of PTX in A549/PTX and H460/PTX cells; MTT assay. (D) The expression of hsa_circ_0003489 and CDK8 mRNA after treatment with RNase R in A549/PTX and H460/PTX cells; qRT-PCR assay. (E) The expression of hsa_circ_0003489 and CDK8 mRNA after treatment with Actinomycin D at the indicated time points in A549/PTX and H460/PTX cells; qRT-PCR assay. *p < 0.05.
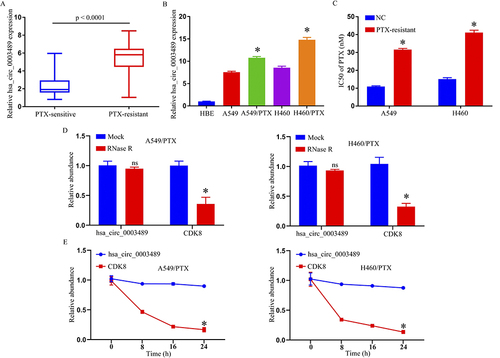
Figure 2 Suppression of PTX resistance in PTX-resistant NSCLC cells hsa_circ_0003489 knockdown. (A) qRT-PCR assay for hsa_circ_0003489 expression in A549/PTX and H460/PTX cells transfected with si-NC or si-hsa_circ_0003489. (B) Cell growth was detected by MTT assay. (C) MTT assay to determine IC50 of PTX in A549/PTX and H460/PTX cells. *p < 0.05.
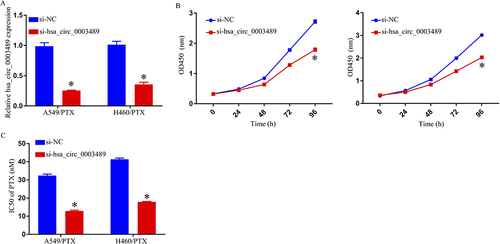
Figure 3 The hsa_circ_0003489 function as the sponge of miR-98-5p. (A) The potential binding sites between hsa_circ_0003489 and miR-98-5p. (B) The interaction between hsa_circ_0003489 and miR-98-5p in 293T cells was determined by dual-luciferase reporter assay. (C) RIP assay was performed to confirm whether hsa_circ_0003489 is bound to miR-98-5p. (D) QRT-PCR assay was used to determine the miR-98-5p level in A549, H460, A549/PTX, and H460/PTX cells. (E) The expression level of miR-98-5p in si-NC or si-hsa_circ_0003489 transfected A549/PTX and H460/PTX cells was examined by qRT-PCR analysis. (F) QRT-PCR assay was used for miR-98-5p level in PTX-sensitive and PTX-resistant NSCLC tissues. (G) The correlation between hsa_circ_0003489 and miR-98-5p in PTX-resistant tumor tissues was estimated by Spearman correlation coefficient analysis. (H) QRT-PCR assay was used to determine the miR-98-5p level in A549/PTX and H460/PTX cells transfected anti-miR-NC or anti- miR-98-5p. (I) Cell growth was detected by MTT assay. (J) IC50 of PTX was estimated by MTT assay. *p < 0.05.
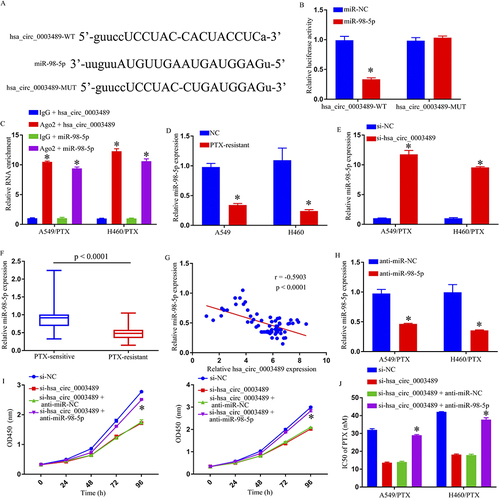
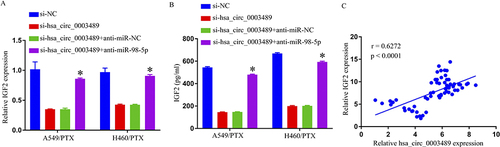
Figure 4 IGF2 was a direct target gene of miR-98-5p. (A) The predicted binding sites between IGF2 3′ UTR and miR-98-5p. (B) The interaction between IGF2 and miR-98-5p in 293T cells was determined by dual-luciferase reporter assay. (C–F) IGF2 expression was determined by qRT-PCR and ELISA. (G) QRT-PCR assay was used for IGF2 level in PTX-sensitive and PTX-resistant NSCLC tissues. (H) Spearman correlation coefficient analysis estimated the correlation between IGF2 and miR-98-5p in PTX-resistant tumor tissues. *p < 0.05.
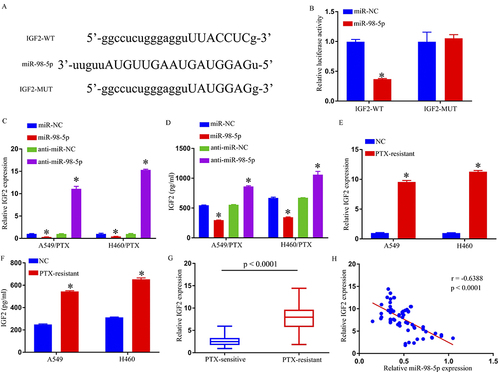
Figure 5 Overexpression of miR-98-5p enhanced PTX sensitivity and repressed cell progression in PTX‑resistant NSCLC cells by targeting IGF2. (A and B) IGF2 expression was determined by qRT-PCR and ELISA. (C) Cell growth was detected by MTT assay. (D) IC50 of PTX was estimated by MTT assay. *p < 0.05.
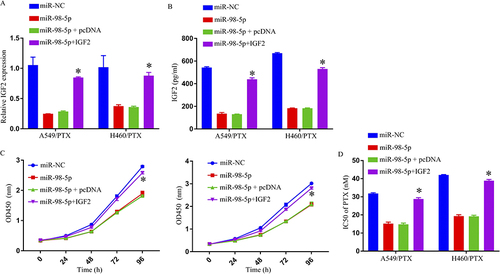
Figure 6 Hsa_circ_0003489 knockdown decreased IGF2 expression through sponging miR-98-5p. (A and B) IGF2 expression was determined by qRT-PCR and ELISA. (C) Spearman correlation coefficient analysis estimated the correlation between IGF2 and hsa_circ_0003489 in PTX-resistant tumor tissues. *p < 0.05.