
Figures & data
Table 1 Participates Characteristics of Both CHD Group and Control Group
Table 2 Comparison of Genotype and Allele Frequency Between CHD Group and Control Group
Table 3 Main Characteristics of All Case-Control Studies Included in Meta-Analysis
Figure 1 PRISMA 2009 Flow Diagram.
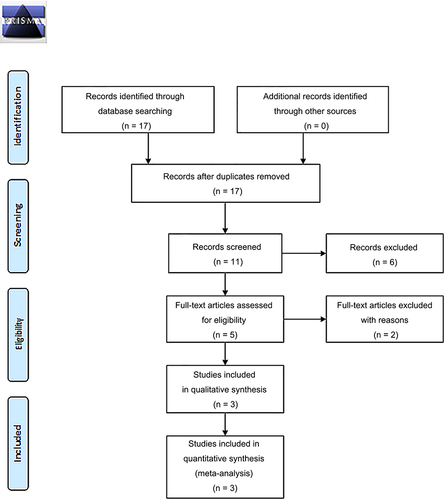
Figure 2 Forest plot for the associations between NQO1 C609T polymorphism and CHD risk through allele contrast (T vs C). Data from these studies.Citation13,Citation15,Citation16
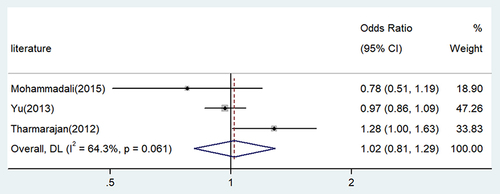
Figure 3 Forest plot for the associations between NQO1 C609T polymorphism and CHD risk through homozygote comparison (TT vs CC). Data from these studies.Citation13,Citation15,Citation16
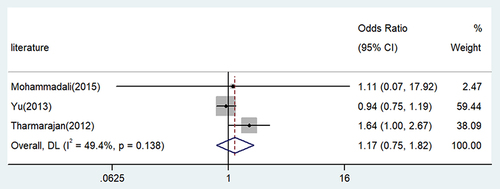
Figure 4 Forest plot for the associations between NQO1 C609T polymorphism and CHD risk through recessive genetic model (TT vs TC/CC). Data from these studies.Citation13,Citation15,Citation16
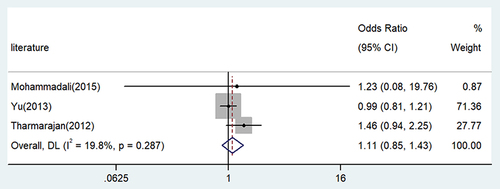
Figure 5 Forest plot for the associations between NQO1 C609T polymorphism and CHD risk through dominate genetic model (TT/TC vs CC). Data from these studies.Citation13,Citation15,Citation16
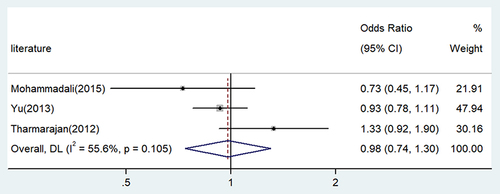
Table 4 Meta-Analysis of the NQO1 C609T Polymorphism and CHD Risk