
Figures & data
Figure 1 Analytical process of this study.
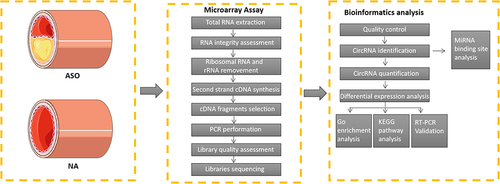
Table 1 The Most Significantly 5 Up-Regulated and 5 Down-Regulated circRNAs (Raw Density of the Normal Group ≥200) in Microarray Analysis
Table 2 The Primer Sequences Used for RT-qPCR (from 5’ to 3’)
Figure 2 (A and B) The histopathology features of HE and EVG stained normal and ASO arterial tissues sections. (C) Medial elastin destruction was graded as I (mild) to IV (severe).
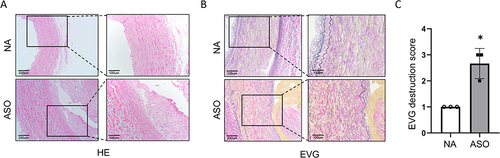
Figure 3 Differentially expressed circRNAs between normal and ASO arterial tissues.
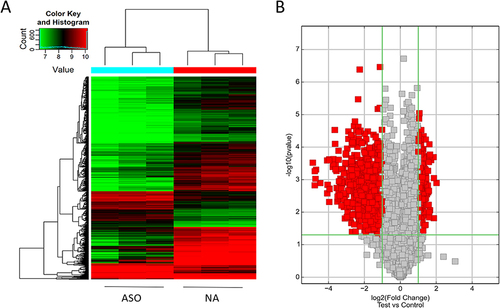
Figure 4 The results of GO and KEGG analysis.
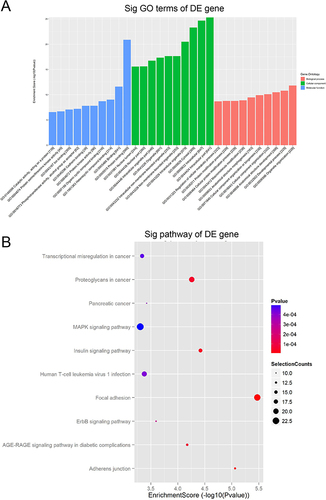
Figure 5 Validation of microarray assay results by RT-qPCR of 10 selected circRNAs (the top 5 upregulated and 5 downregulated circRNAs, raw density of the normal group ≥200).
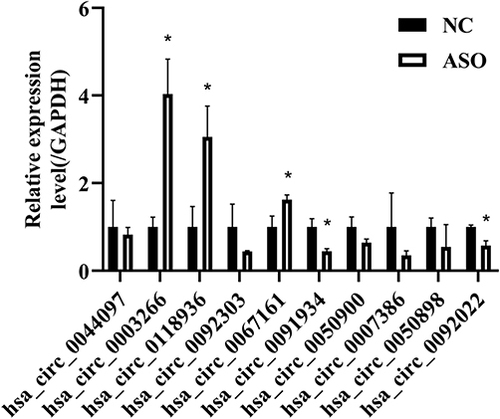
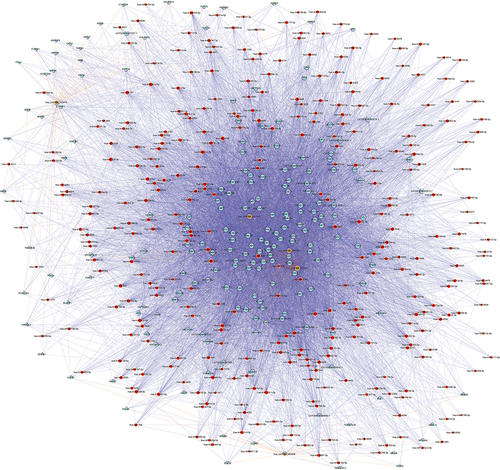
Figure 6 The construction of circRNA-miRNA-mRNA network.
Data Sharing Statement
The dataset of the raw and processed sequencing data originated from this study is freely available from the online repositories: National Center for Biotechnology Information (NCBI) Gene Expression Omnibus (GEO) database (GSE152280).