Figures & data
Table 1 Correlation Between circPVT1 Expression and Clinicopathological Characteristics in Bladder Cancer
Figure 1 The expression of mRNA PVT1 and circPVT1 in BLCA and normal tissues. (A–E) Statics analysis of expression level. (A) Difference in PVT1 mRNA expression between tumor and normal tissues. (B) Difference in circPVT1 expression between tumor and normal tissues. (C) Association between mRNA PVT1 and circPVT1 expression in tumor and normal tissues. (D) Difference in PVT1 mRNA expression between tumor and normal cell lines. (E) Difference in circPVT1 expression between tumor and normal cell lines. (F and G) Correlation between mRNA PVT1 and circPVT1 expression in normal tissues (F) and BLCA tissues (G). (H) AUC: area under the ROC (receiver operating characteristic) curve of circPVT1 and mRNA PVT1. (I and J) Stability of circPVT1 and mRNA PVT1 after RNase R treatment in T24 (I) and UMUC3 (J) cell lines. #Represents P > 0.05, *Represents P < 0.05, **Represents P < 0.01, ***Represents P < 0.001.
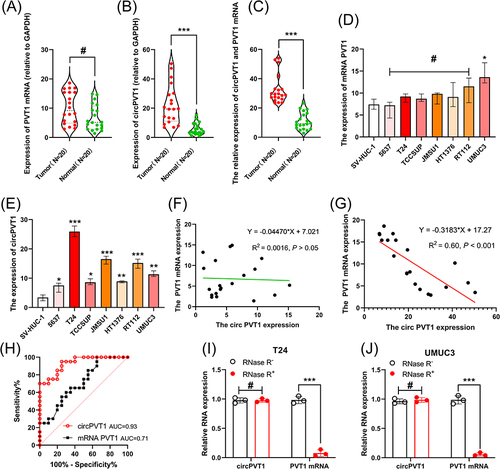
Table 2 Univariate and Multivariate Cox Regression Analyses of Prognostic Factors in Bladder Cancer
Figure 2 Association of circPVT1 expression and HER2 amplification with overall survival. The representative images of HER2 negative (A) and positive (B) amplification at the DNA level. The representative images of HER2 negative (C) and positive (D) amplification by IHC at the protein level. Kaplan–Meier curves were generated by HER2 amplification (E), circPVT1 expression (F) and HER2 amplification with circPVT1 expression (G), respectively.
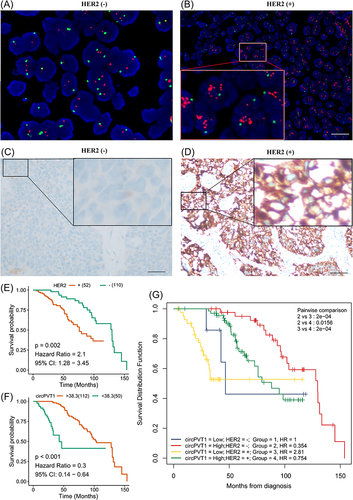
Figure 3 The nomogram was constructed based on circPVT1 expression and clinical characteristics. The alignment diagram of nomogram for predicting OS (A). The efficiency of the nomogram for the 3-year (B) or 5-year survival (C).
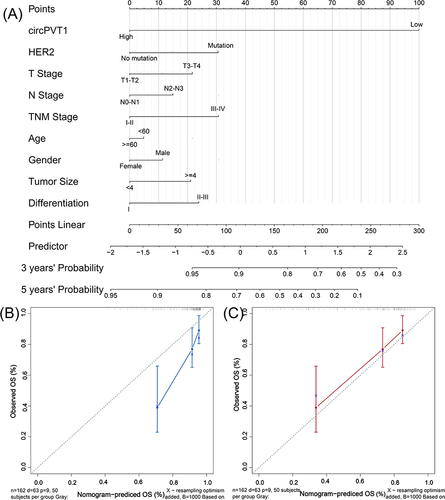
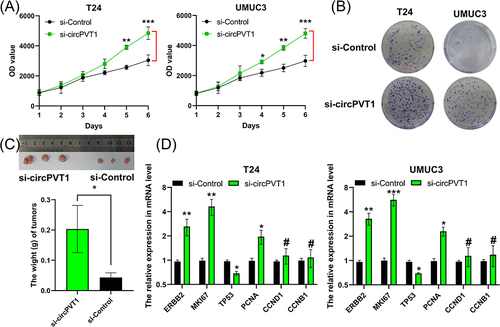
Figure 4 Knockdown of circ-PVT1 promotes BLCA proliferation in vitro and in vivo. (A–C) The proliferation in vitro and in vivo, growth curves of cell lines (A), colony formation (B), mouse tumor model (C). (D) The expression by qRT-PCR method. #P>0.05, *P<0.05, **P<0.01 and ***P<0.001.