Figures & data
Figure 1 Workflow of lncRNA and mRNAs analysis for patients with T2DM versus healthy controls.
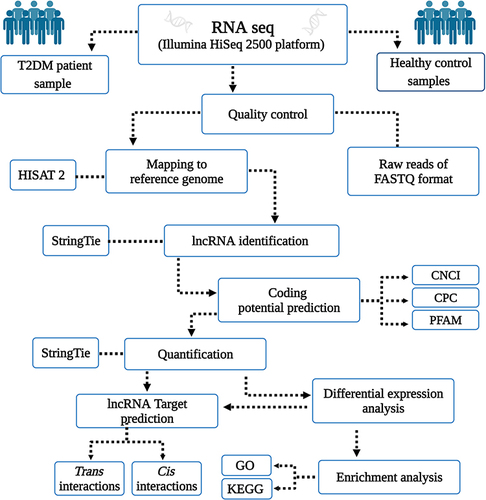
Table 1 Quality Parameter Information for Transcriptome Data for Both Patients with T2DM and Healthy Controls
Figure 2 lncRNA transcriptome analysis in the T2DM group compared with the healthy control group. (A) Venn diagram representing predicted lncRNA findings using CNCI, CPC, and PFAM. The sum of the numbers in each large circle reflects the overall number of noncoding transcripts, and the portions of the circle that overlap represent the noncoding transcripts identified by all three methods. (B) A pie chart of lncRNA classification—sense overlapping, lincRNA (long intergenic noncoding RNA), sense intronic, antisense, and other distributions.
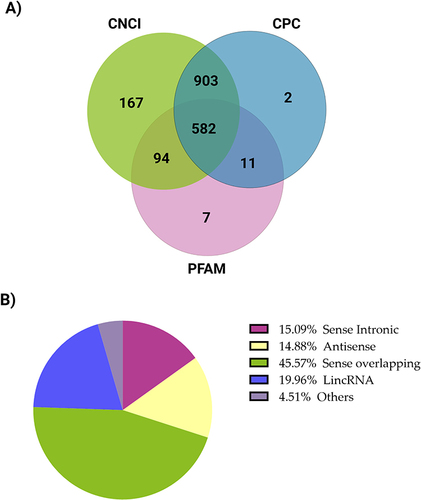
Figure 3 Venn Diagram of uniquely expressed and co-expressed lncRNAs and mRNAs in the T2DM and healthy control groups. Expression pattern of (A) lncRNAs and (B) mRNAs.
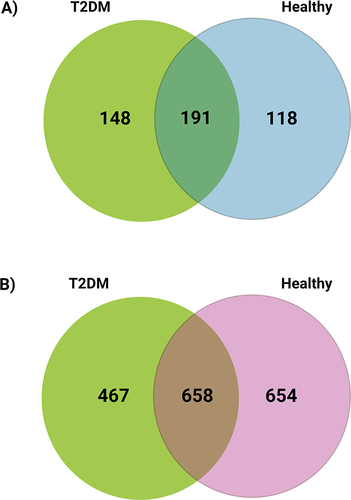
Figure 4 lncRNAs and mRNA expression profiles in T2DM and healthy control groups. Volcano plots clustering analysis of (A) lncRNAs and (B) mRNA. Pie charts represent the percentage of differentially expressed (C) lncRNAs and (D) mRNA. P < 0.05 was considered significant; expression changes are shown in the T2DM group compared with those in the healthy control group. Magenta represents genes whose expression has increased by >2 fold, while green represents genes whose expression has decreased by >2 fold.
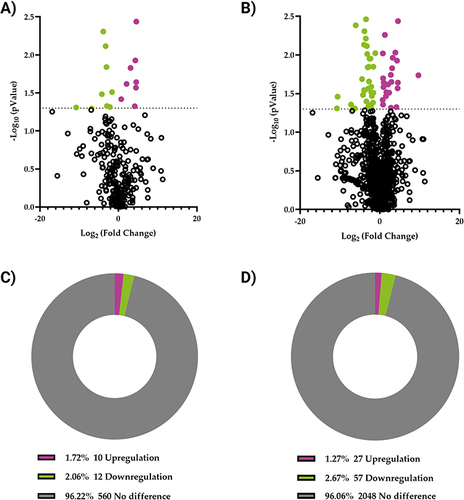
Table 2 Top 10 Differentially Expressed lncRNAs in the T2DM and Healthy Control Groups
Table 3 Top 10 Differentially Expressed mRNAs in the T2DM and Healthy Control Groups
Figure 5 Hierarchical clustering analysis of significant differential expression profiles between T2DM and healthy groups. (A) lncRNAs and (B) mRNAs. Each row is a transcript ID, and each column represents a sample. Upregulation is represented by magenta, whereas downregulation is represented by green.
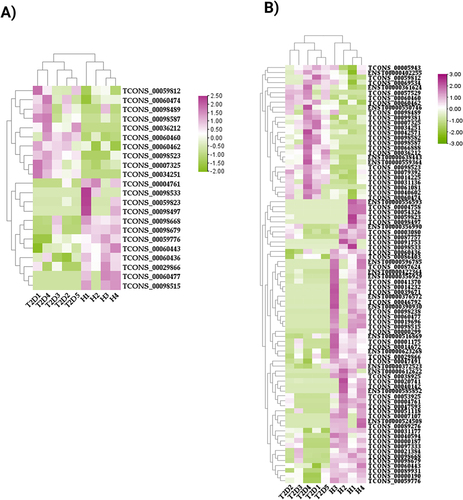
Table 4 Differentially Expressed mRNAs Cross-Referenced with T2DM GWAS Available at https://t2d.hugeamp.org
Table 5 Prediction of Top Differentially Expressed lncRNA-Target mRNA Genes via lncRNA–mRNA Co-Expression Trans-Interaction in the T2DM Group Compared with the Healthy Control Group
Figure 6 Gene Ontology enrichment analysis of differentially expressed lncRNA target genes and mRNAs in the T2DM and healthy groups. (A) Molecular functions (MF), (B) cellular components (CC), and (C) biological processes (BP) of lncRNA target genes. (D) MF, (E) CC, and (F) BP of mRNA.
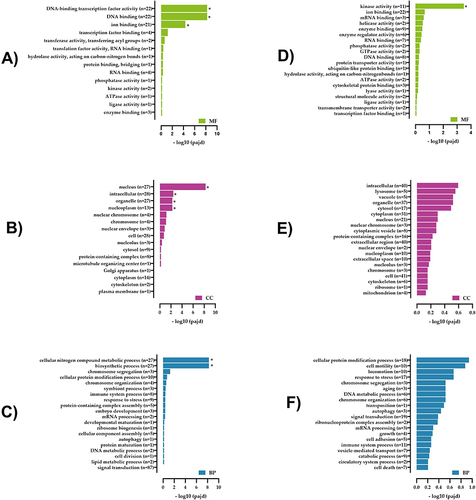
Figure 7 KEGG pathway analysis of differentially expressed lncRNA targets and mRNAs in T2DM and healthy groups. (A) Upregulated and (B) downregulated KEGG pathways of lncRNA target genes. (C) Upregulated and (D) downregulated KEGG pathways of mRNA.
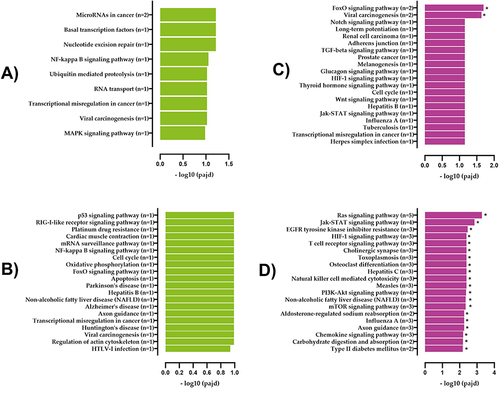
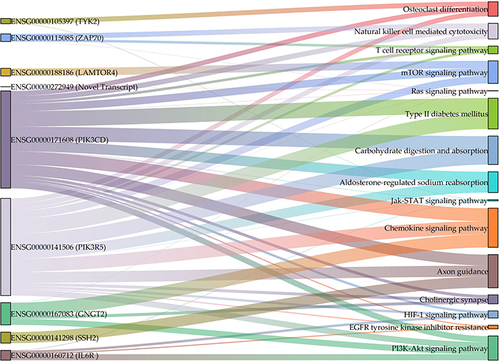
Figure 8 Enriched mRNA transcript genes in the KEGG pathways most likely involved in T2DM. The graph was generated using Origin Pro 2023 (OriginLab, Northampton, MA, USA).