
Figures & data
Figure 1 Identification of DEARGs in AS. (A) Volcano plots of DEGs. (B) Venn diagram used to identify 29 DEARGs. (C) Heatmap pattern of the DEARGs.
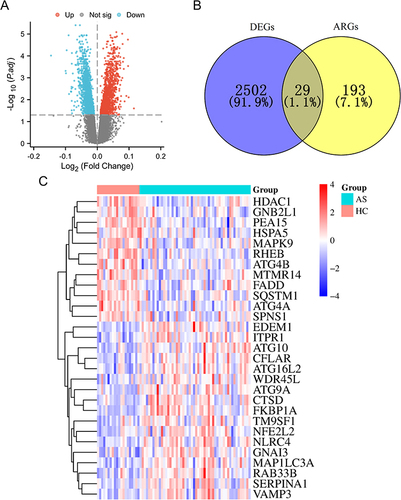
Figure 2 Functional enrichment analysis of 29 DEARGs. The results of GO (A) and KEGG (B) were shown by circle charts.
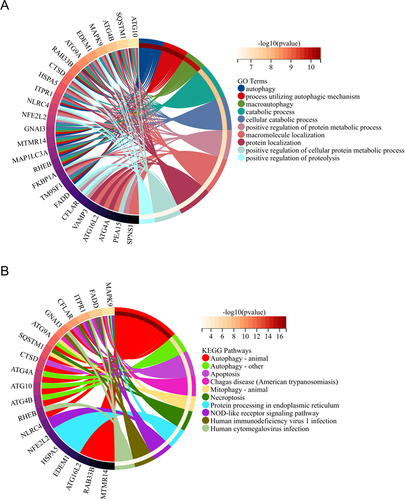
Figure 3 Identification of core DEARGs by PPI network analysis. (A) Protein-protein interaction networks of the 29 DEARGs. (B) Intersection diagram of top 10 genes based on 11 topological algorithms. Green outlined section indicates core genes identified through the use of 11 algorithms.
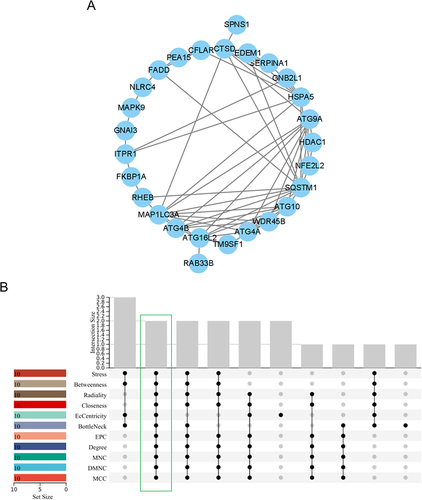
Figure 4 Analysis core DEARGs in GSE73754 dataset. (A) Gene expression level of HSPA5 and SQSTM1. (B) ROC curve of HSPA5 and SQSTM1. **p < 0.01 and ***p < 0.001.
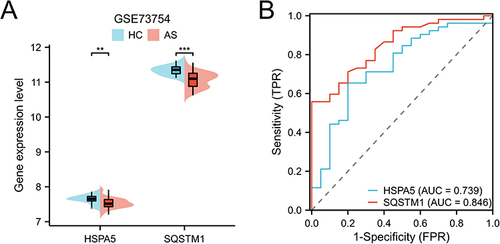
Figure 5 Validation of core DEARGs by clinical blood samples. *p < 0.05 and ***p < 0.001.
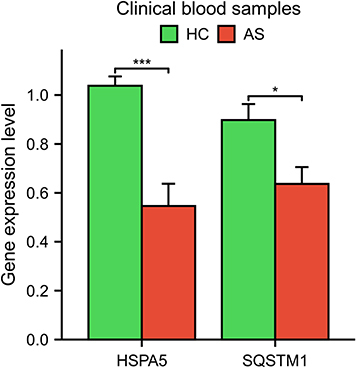
Figure 6 Immune infiltration analysis. (A) The landscape of the immune cells between HC and AS groups. (B and C) Correlation analysis between the hub DEARGs (HSPA5 and SQSTM1) and immune cell infiltration levels. *p < 0.05, **p < 0.01, and ***p < 0.001; ns indicates no statistical difference.
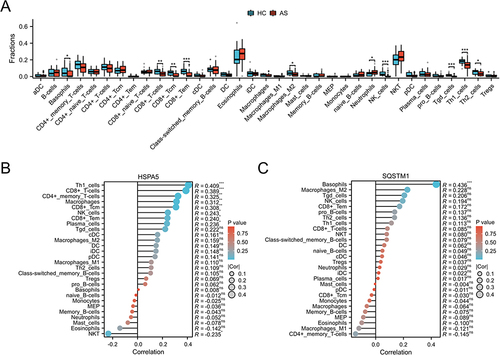
Figure 7 Single-gene GSEA analysis based on the median value of HSPA5 gene expression level.
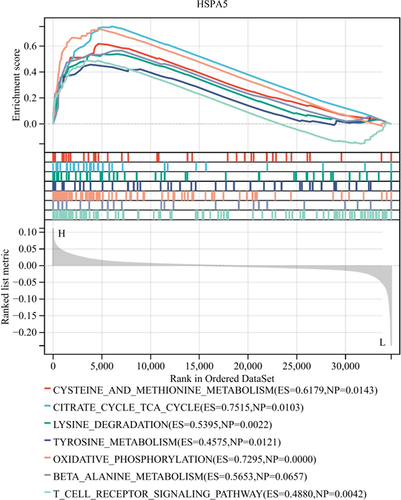
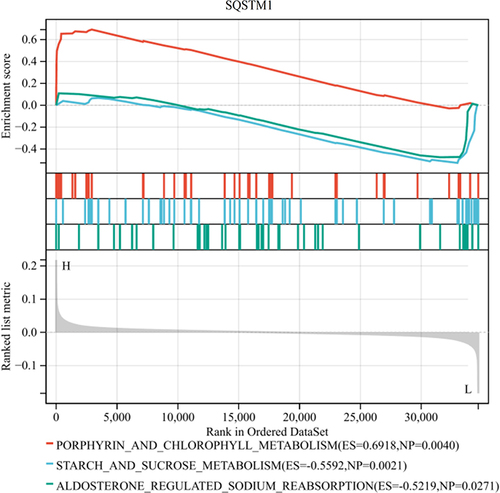
Figure 8 Single-gene GSEA analysis based on the median value of SQSTM1 gene expression level.
Data Sharing Statement
The data are available from the corresponding author upon reasonable request.