Figures & data
Table 1 The Primer Sequences of Prognostic Genes
Figure 1 Identification of differentially expressed lipid metabolism-related genes (DELMGs) in esophageal squamous cell carcinoma (ESCC). (A) The volcano plot of differentially expressed genes (DEGs) between ESCC and control samples. (B) The heatmap of the top 10 up-regulated and down-regulated DEGs. (C) Venn diagram of DEGs and lipid metabolism-related genes.
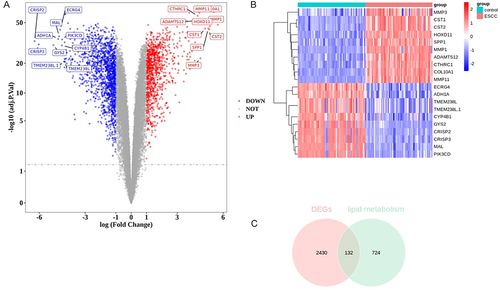
Figure 2 Functional enrichment analysis of DELMGs. (A and B) The Gene Ontology (GO) terms enriched in DELMGs. (C and D) The Kyoto Encyclopedia of Genes and Genomes (KEGG) pathways enriched in DELMGs.
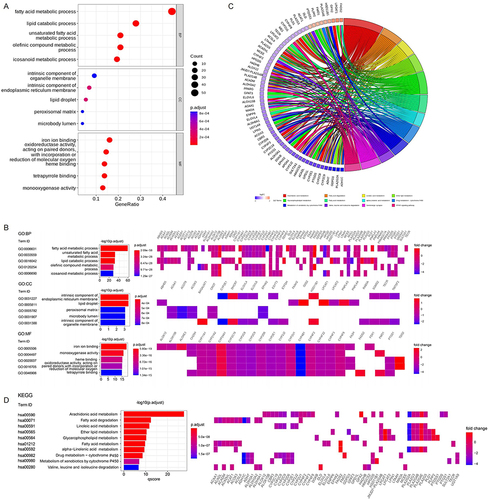
Figure 3 Construction of prognostic model for ESCC based on the DELMGs. (A) The results of univariate Cox analysis in the training dataset. (B and C) The plot of gene coefficients (B) and error plots for 10-fold cross-validation (C) in least absolute shrinkage and selection operator (LASSO) analysis. (D) The distribution plot of risk score. (E) The survival state distribution of samples. (F) The Kaplan-Meier curve for high- and low-risk groups. (G) The receiver operating characteristic (ROC) curve of the prognostic model with 1,2,3 years as survival time points.
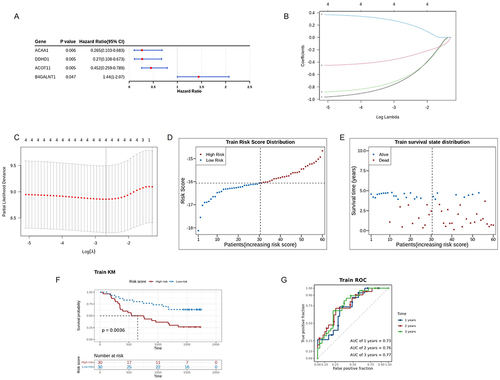
Figure 4 Validation of the 4-gene signature in the TCGA dataset. (A) The distribution plot of risk score in the TCGA dataset. (B) The survival state distribution of samples in the TCGAdataset. (C) The Kaplan-Meier curves of high- and low-risk groups. (D) The ROC curves of prognostic model in the TCGA dataset.
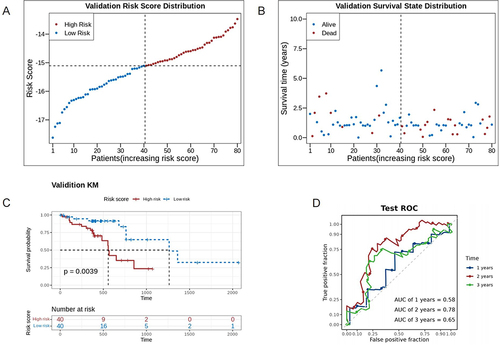
Figure 5 Immune infiltration analysis for ESCCsamples. (A) The distribution of 28 infiltrating immune cells in the ESCC and normal samples; (B) 10 cell types are significantly different in high- and low-risk groups. *p<0.05; **p<0.01, ***p<0.001. (C) The expression of 16 immune checkpoints is significantly different between high- and low-risk groups. *p<0.05; **p<0.01.
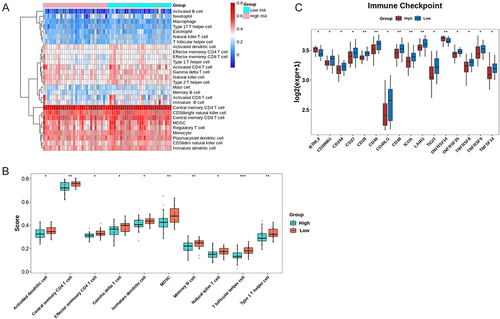
Figure 6 Prediction of therapeutic sensitivity in patients with different risk scores.
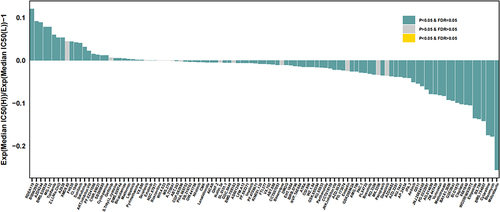
Figure 7 Independent prognostic analysis and nomogram creation. (A and B) The independent predictors obtained by univariate (A) and multivariate (B) Cox regression analysis. (C) Construction of the nomogram to predict the probability of 1-, 2-, and 3-year overall survival (OS) rates; (D) The calibration curve of the nomogram.
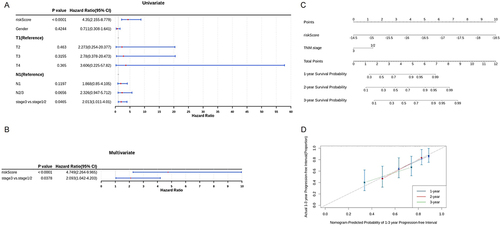
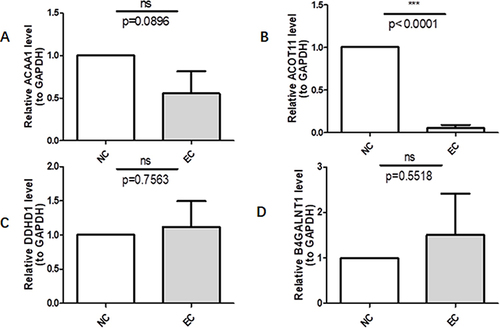
Figure 8 Validation of the prognostic genes’ expression by Q-PCR. ***p<0.001. (A) It represents the relative expression of ACAA1 in esophageal squamous cell carcinoma and normal tissue verified by PCR; (B) It represents the relative expression of ACOT11 in esophageal squamous cell carcinoma and normal tissue verified by PCR; (C) for B4GALNT1, and (D) for DDHD1.