
Figures & data
Figure 1 Two Han Chinese families with EH, arrows indicate the probands.
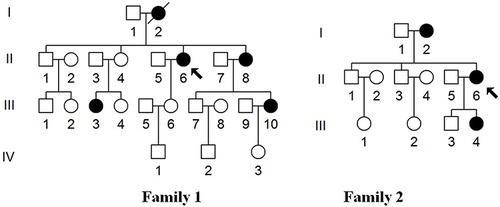
Table 1 Summary of Clinical Data for Some Members in Two Families with EH
Table 2 mtDNA Sequence Variations in Two Families with EH
Figure 2 Identification of tRNAGlu A14693G and A14696G mutations by direct sequencing.
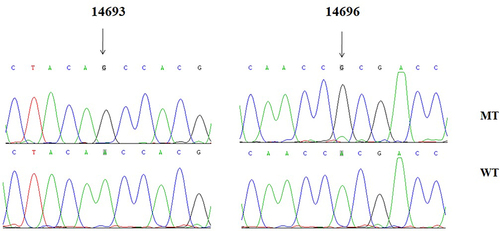
Figure 3 Secondary structure of tRNAGlu gene with and without the m.A14693G and m.A14696G mutations.
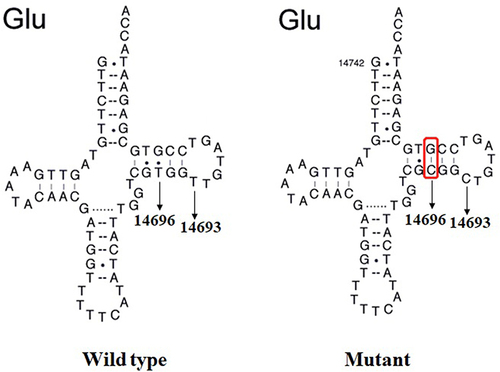
Figure 4 Alignment of tRNAGlu gene from various species, arrows indicated the positions of 51 and 54, corresponding to the m.A14696G and m.A14693G mutations.
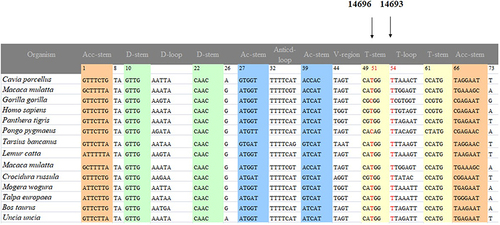
Figure 5 Prediction of tRNAGlu secondary structure with and without the m.A14696G and m.A14693G mutations.
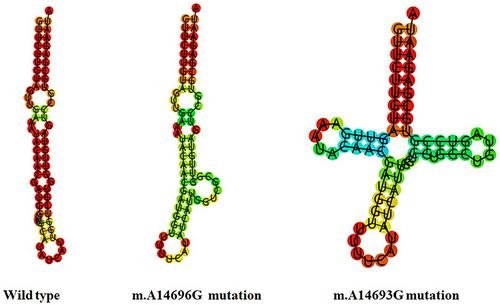
Figure 6 Analysis of mitochondrial functions in cybrids. (A) mtDNA copy number; (B) ATP analysis; (C) ROS analysis; (D) MMP analysis.
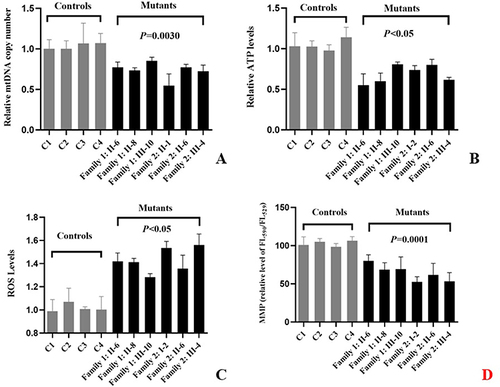
Table 3 The Pathogenicity Scoring System for m.A14693G and m.A14696G Mutations
Data Sharing Statement
The datasets used and analyzed during the current study are available from corresponding author (Chun Wang, E-mail: [email protected]) on reasonable request.