Figures & data
Table 1 The Clinical Characteristics of the Patients in the Study Sample Were Included
Figure 1 The association between the degree of P3H1 expression in tumors and the clinical characteristics of bladder cancer. (A) P3H1 expression in several types of cancers. (B) Differential expression of P3H1 in paired and unpaired bladder cancer tissues. (C) The expression of P3H1 in tumor tissues and matching paracancer tissues has been analyzed using TCGA data. (D) Kaplan-Meier survival analysis of patients with high or low P3H1 expression. (E-I) The distribution of P3H1 expression in various bladder cancer clinical features. “***” indicates p<0.001.
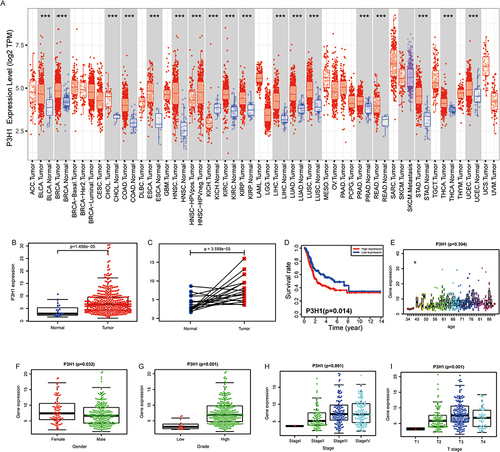
Figure 2 Distribution of P3H1 expression in different bladder cancer tissue subtypes. (A-F) Distribution of P3H1 in different subtypes of bladder cancer according to six different subtypes of tissue classification methods.
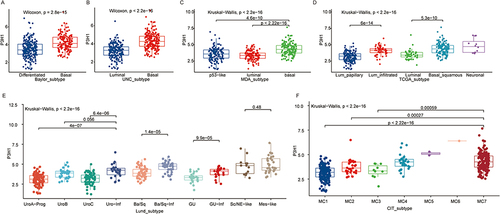
Figure 3 COX proportional hazards model, immunohistochemistry and gene set enrichment analysis. (A) Univariate COX proportional hazards model. (B) Multivariate COX proportional hazards model. (C) Expression of P3H1 in tissue samples with different T grades. (D) AOD difference analysis of immunohistochemistry staining between cancer tissues and paired adjacent tissues. (E) Distribution of AOD ratio between cancer tissue and paired adjacent tissue in patients with different T grades. (F) Gene enrichment analysis entries were performed for biological functions in the gene ontology database. (G) Gene enrichment analysis entries of key pathways in Kyoto encyclopedia of genes and genomes database were performed. AOD, average optical density.
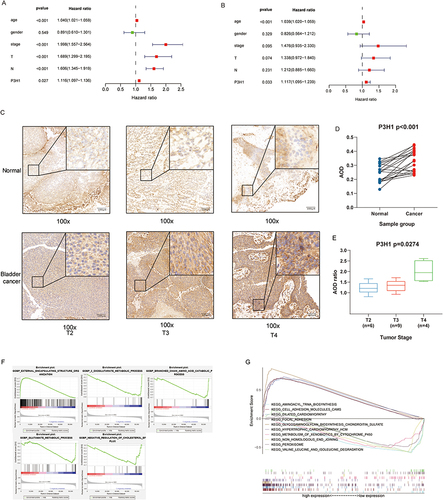
Figure 4 Analysis of the association between P3H1 high and low expression samples and immune cell infiltration. (A) Evaluation of stromal cells and immune cells in the microenvironment of tumor samples by estimation algorithm; (B and C) Differences in immune cell infiltration and functional activity in P3H1 high and low expression samples. (D) The correlation between P3H1 expression and immune cell infiltration was analyzed based on TIMER database. (E) Distribution of P3H1 on samples of different immune subtypes. (F-I) Correlation analysis between P3H1 and immune function based on Thomas’ study. (J) Distribution of immunotherapy target genes in high and low P3H1 expression samples. “*”, “**”, “****” indicates p<0.05,0.01,0.001, respectively.
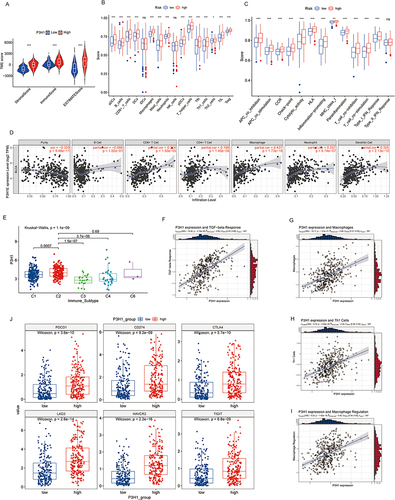
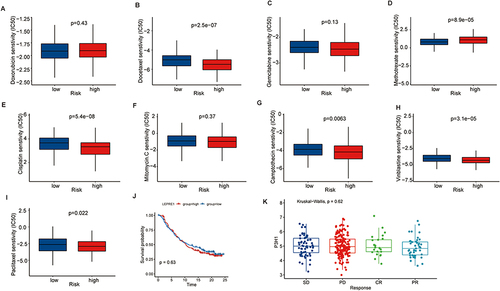
Figure 5 Prediction of drug sensitivity based on P3H1 expression. (A-I) To predict the sensitivity of chemical drugs commonly used in bladder cancer. (J) Kaplan-Meier analysis of overall survival after treatment with atezolizumab in patients with high and low P3H1 expression. (K) Distribution of P3H1 expression in samples with different immunotherapy outcomes.