Figures & data
Table 1 Characteristics of Our External Dataset
Figure 1 Tacrolimus concentration over time of the observed patients.
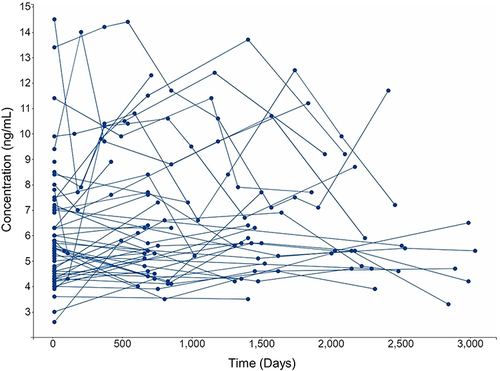
Figure 2 PRISMA diagram of screening Tacrolimus PopPK studies.
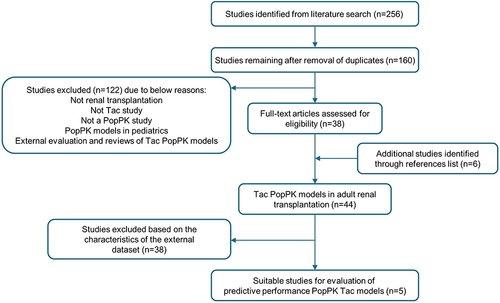
Table 2 Summary of Demographic Characteristics of the Included Published Studies
Table 3 Summary of Structural, Statistical, and Covariate Models of the Included Published Studies
Figure 3 The MPE differences between Bayesian approach and priori approach.Citation11–15
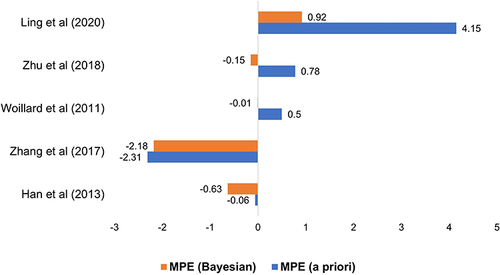
Figure 4 The MAPE differences between Bayesian approach and priori approach.Citation11–15
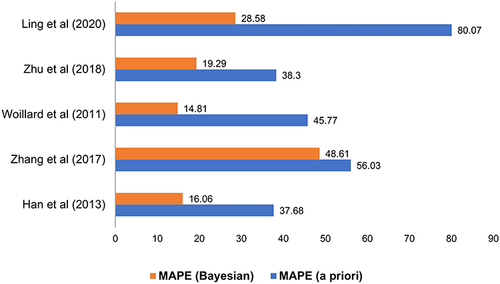
Figure 5 Individual-predicted concentrations against observed concentration using Goodness-of-fit plot.Citation11–15
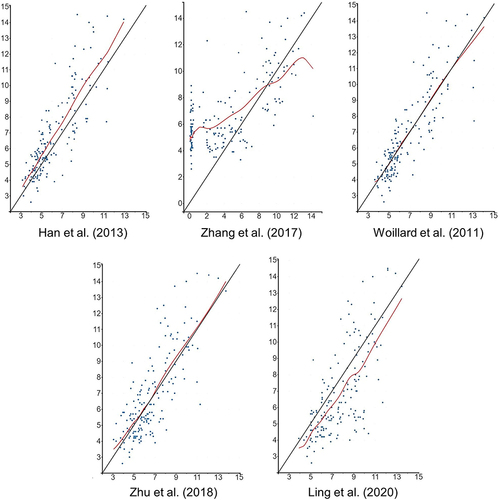
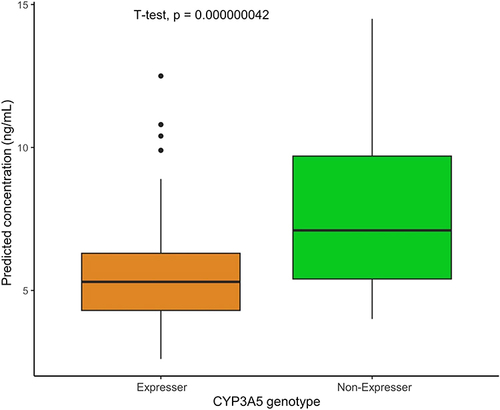
Figure 6 The difference on predicted concentrations between two groups of expressers versus non-expresser CYP3A5.