Figures & data
Table 1 Primer Sequences Used for qPCR
Table 2 The List of the Antibodies Used for Western Blotting
Figure 1 FBLN5 was decreasingly expressed in KIRC tissues versus normal kidney tissues.(A) Analysis of FBLN5 expression in various cancers and normal tissues using SangerBox; (B) Analysis of FBLN5 expression in various cancers and normal tissues using the TIMER database; (C) Analysis of FBLN5 expression in KIRC and adjacent normal tissues using the GEPIA database; (D) Analysis of FBLN5 expression in KIRC and adjacent normal tissues using the UALCAN database; (E) Analysis of FBLN5 expression in KIRC using the HPA database; (F) Analysis of FBLN5 expression in normal kidney tissues using the HPA database.*p < 0.05,**p < 0.01, ***p < 0.001 and ****p < 0.0001.
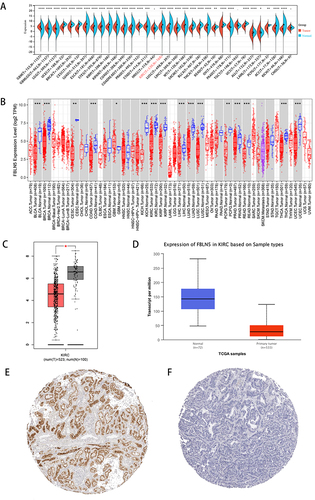
Figure 2 FBLN5 expression in different patient groups. Box plots showed the relationship between FBLN5 expression and parameters including (A) age, (B) gender, (C) race, (D) tumor grade, (E) nodal metastasis status, (F) subtype, (G) cancer stage was analyzed using the UALCAN database.
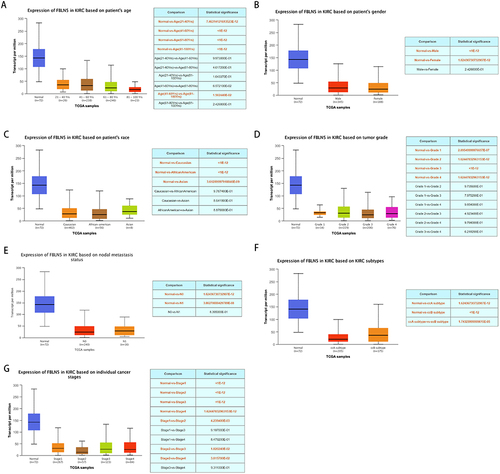
Figure 3 FBLN5 most likely served an immune function in KIRC’s tumor microenvironment.(A) Volcano plot showed the co-expressed mRNAs of FBLN5 in KIRC using Linkedomics database; (B and C) The heat maps showed the top 50 positively and negatively expression correlated genes of FBLN5; (D) The FBLN5 relevant biological processes (BP), cellular compartments (CC) and molecular functions (MF); (E) The FBLN5 relevant pathways in KIRC.
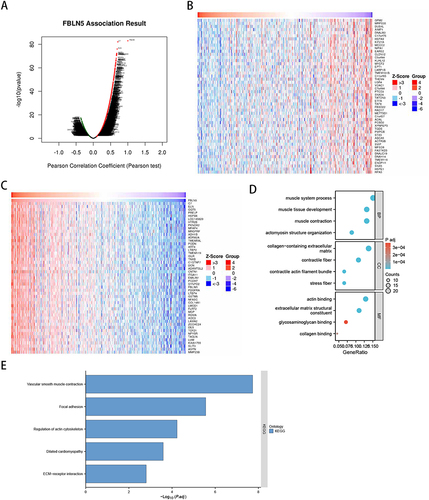
Figure 4 Relationships between FBLN5 and tumor immune microenvironment in KIRC; (A) immune genes; (B) immune checkpoint.*p < 0.05.
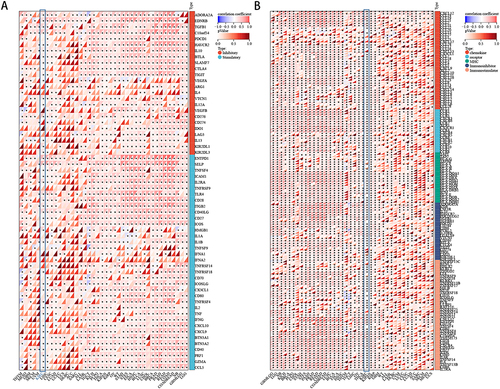
Figure 5 Relationships between FBLN5 and tumor immune microenvironment. (A and B) tumor infiltrating immune cellsanalysed analyesed by Linkedomics database; (C) tumor infiltrating immune cells using SangerBox; (D–F) the relationship between the expression of FBLN5 and infiltration was showed as stromal, immune and ESTIMATE scores, respectively.***p < 0.001.
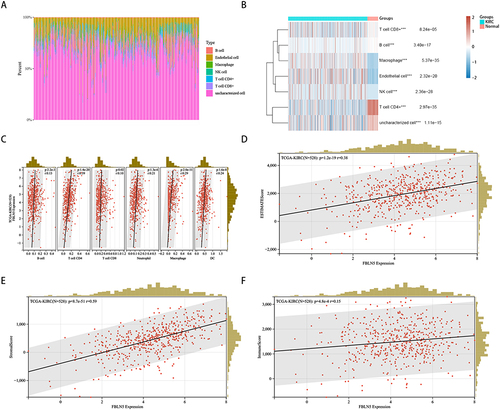
Figure 6 Influence of FBLN5 expression on the survival in KIRC patients with high or low immune cell infiltration.(A) The pan-cancer survival analysis of FBLN5 by SangerBox; (B) Effect of FBLN5 expression on survival in KIRC patients by Kaplan-Meier Plotter; (C) Effect of FBLN5 expression on survival in KIRC patients by GEPIA database; Effect of FBLN5 expression on survivals in KIRC patients with enriched or decreased infiltration ratios of (D and E) basophils, (F and G) B cells, (H and I) CD4+ memory T cells, (J and K) type 1 T helper cells, (L and M) type 2 T helper cells, (N and O) CD8+ T cells, (P and Q) regulatory T cells, (R and S) natural killer T cells, (T and U) macrophages, (V and W) eosinophils, which were performed on Kaplan-Meier plotter database.
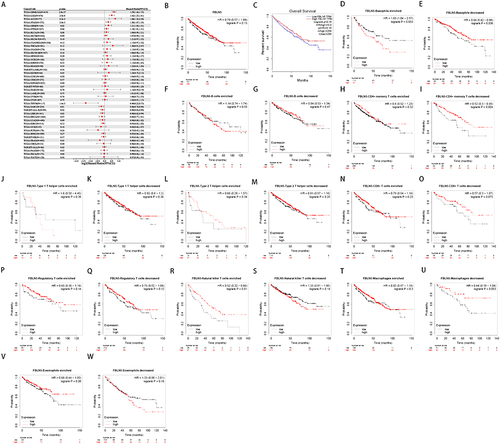
Table 3 Cox Univariate and Multivariate Analyses of FBLN5 Gene Expression
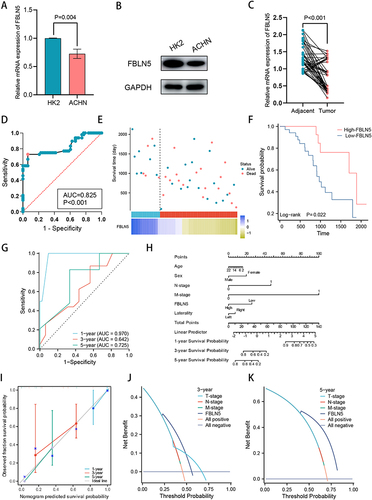
Figure 7 FBLN5 was a potential prognostic gene for children and young adults with KIRC. (A) FBLN5 expression was lower in ACHN compared to HK2 cell line in mRNA level; (B) FBLN5 expression was lower in ACHN compared to HK2 cell line in protein level; (C) FBLN5 expression was lower in tumor tissues compared to adjacent normal tissues; (D) ROC curves for the diagnostic of FBLN5 in children and young adults with KIRC; (E) The survival time and the relative expression of FBLN5 for the 48 patients; (F) The Kaplan-Meier curve showed the impact of FBLN5 expression on the survival in children and young adults with KIRC; (G) FBLN5 showed a good value in predicting the prognosis of KIRC in children and young adults using the time dependent ROC; (H) A predictive nomogram based on the FBLN5 risk score and other clinicopathological variables predicted the 1-, 3-, and 5-year survival in children and young adults with KIRC; (I) Calibration curves indicated the agreement between anticipated and actual survival rates after 1, 3, and 5 years; (J and K) DCA diagrams based on FBLN5 expression and tumor stage.