
Figures & data
Figure 1 The flowchart of this study.
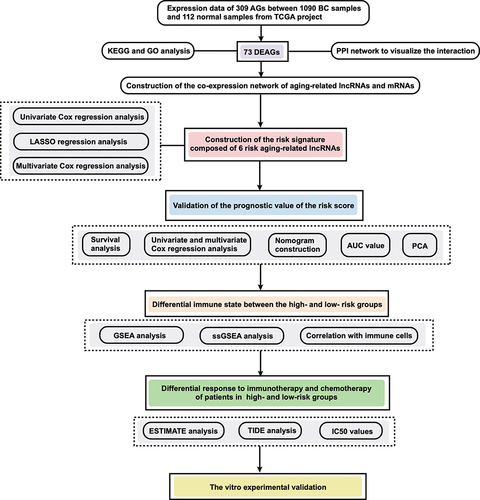
Figure 2 The expression, PPI, and function analysis of DEAGs and risk model construction. (A) A heatmap of the expression level of 73 DEAGs between the normal (N, blue) and BC tissues (T, red). (B) PPI network visualizing the interactions of DEAGs (interaction score = 0.5). (C) Barplot graph for KEGG analysis of DEAGs. The longer the bar, the more enriched the genes; The deeper the red, the more obvious the differences (q-value: the adjusted p-value). (D) Bubble graph for GO analysis of DEAGs. The bigger the bubble, the more enriched the genes; The deeper the red, the more obvious the differences (q-value: the adjusted p-value). (E and F) LASSO regression analysis of the 6 prognostic AG-lncs. (G) The forest plot of the HR for the correlation between 6 AG-lncs and OS of BC.
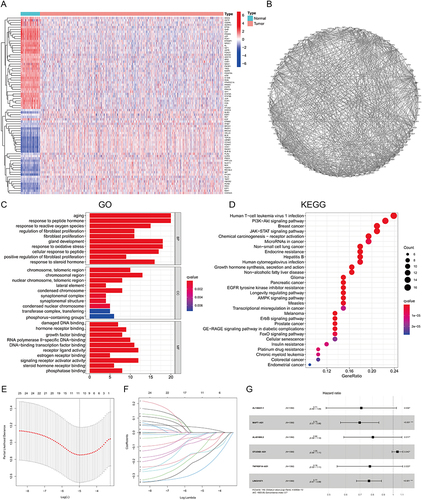
Figure 3 Identification of prognostic aging-related lncRNA signature in training and testing cohort. The distribution and survival status of BC patients with different risk scores in training cohort (A) and testing cohort (B). The green and red dots represented survival and death, respectively. The heatmap exhibited the expression levels of the 6 AG-lncs in the high- and low-risk groups. The Kaplan-Meier survival analysis showed the OS, the PFI, and the DSS of BC patients between high- and low-risk groups in the training cohort (C–E) and testing cohort (F–H).
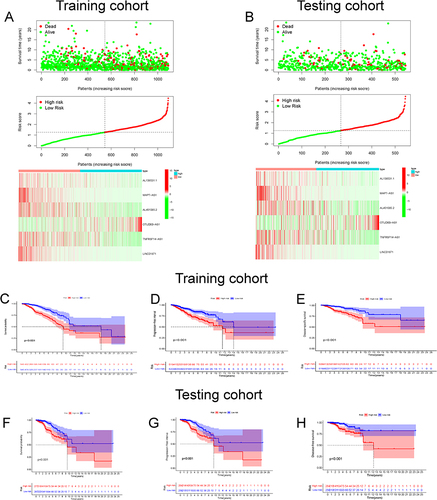
Figure 4 The development of nomogram and ROC analysis. Construction of a nomogram containing the risk score and other independent clinical factors to predict BC’s 1-, 3-, and 5-year OS of BC in training cohort (A) and testing cohorts (B). *p < 0.05, **p < 0.01; ***p < 0.001. The calibration plots of the nomograms in terms of the agreement between nomogram-predicted and observed 1-, 3- and 5-year and 5-year survival outcomes of BC in training cohort (C) and testing cohort (F). The ROC curves of the risk score at 1-, 2-, and 3-year in training cohort (D) and testing cohort (G). The AUC for the risk score and other clinical features (age, stage, TNM stage) based on the ROC curves in the training cohort (E) and testing cohort (H).
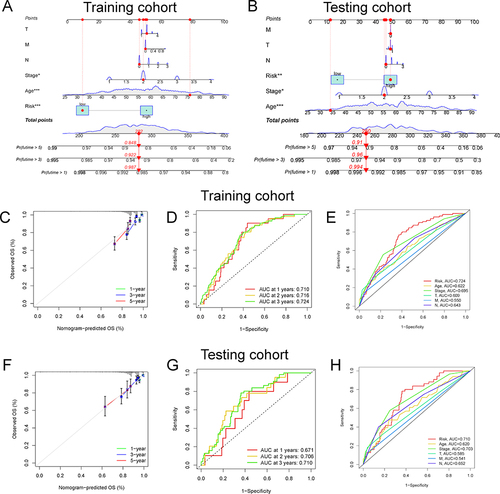
Figure 5 Functional enrichment analysis between the high- and low-risk groups by GSEA. (A) The GO analysis of the significantly enriched biological process between the high- and low-risk groups. (B) The KEGG analysis of the significantly enriched signaling pathways between the high- and low-risk groups. The 3D scatterplot of the PCA showed the distribution of BC patients based on all AGs (C), all AG-lncs (D), and the 6 AG-lncs (E).
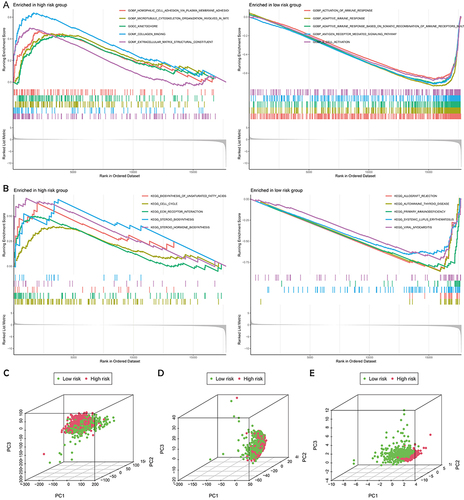
Figure 6 Verification of the optimal aging-related lncRNA signature. (A) The ROC curves of the risk score and other 4 signatures at 1-, 3-, and 5 years. (B) The concordance index of the risk score and the other 4 signatures. (C) The Kaplan-Meier survival analysis for OS of BC patients between high- and low-risk groups based on the risk score and other 4 signatures. (D) The HR of the risk score and the other 4 signatures.
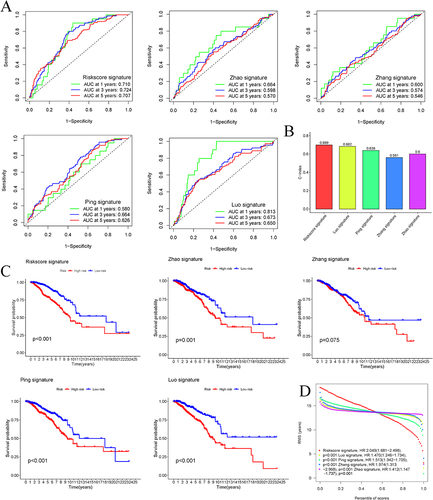
Figure 7 The correlation of the risk score with the clinical features of BC patients. (A) The heatmap visualizing the distribution of the 6 AG-lncs in two risk groups and different BC clinical outcomes (age, gender, TNM stage, and state). (B) The expression of 6 AG-lncs between high- and low-risk groups. ***p < 0.001. The correlation of the risk score with various clinical characteristics of BC, including age (C), state (alive or dead) (D), clinical stage (E), and TNM stage (F–H). The mutation frequency and classification of all genes in BC patients between low-risk group (I) and high-risk group (J).
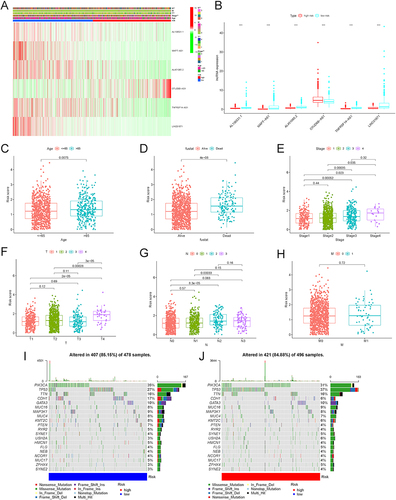
Figure 8 The differential immune state between the two risk subgroups. Comparison of the ssGSEA scores of 16 types of immune cells (A) and 13 immune-related pathways (B) between low-risk (blue box) and high-risk (red box) groups in the TCGA project. *p < 0.05, **p < 0.01; ***p < 0.001. (C) The tumor purity, ESTIMATE score, Stromal score, and Immune score between the low- and high-risk groups. (D) The correlation between immune cells. (E) The Pearson correlation analysis of the risk score with the immune cells.
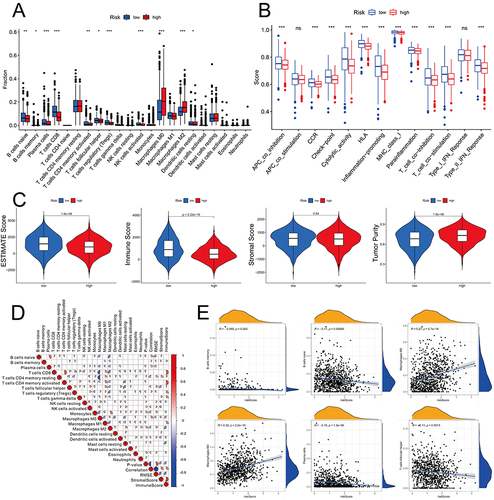
Figure 9 The differential response to the immune therapy between the high- and low-risk groups. (A) The TIDE, microsatellite instability, and T-cell exclusion and dysfunction score in two risk subgroups. The scores between the two risk subgroups were compared through the Wilcoxon test. ns, no significance; ***p < 0.001. (B) The expression levels of immune checkpoint molecules between the high- and low-risk groups in BC. *p < 0.05, **p < 0.01; ***p < 0.001. (C) The expression levels of m6A-related genes between the high- and low-risk groups in BC. **p < 0.01; ***p < 0.001. The IC50 of chemotherapeutic drugs such as doxorubicin (D), etoposide (E), and rapamycin (F) was higher in the high-risk group.
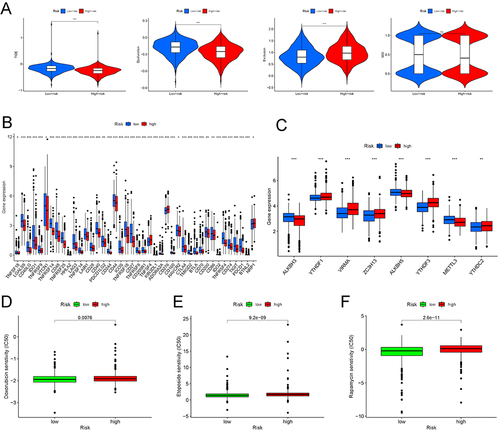
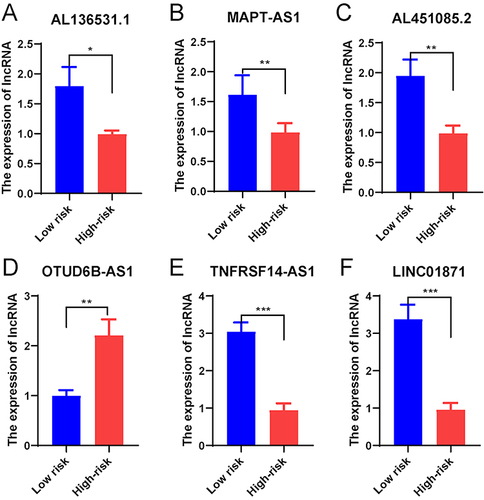
Figure 10 Validation of the predictive ability of the risk score in an external cohort. The expression of 6 AG-lncs in BC patients at different clinical stages: (A) al136531.1, (B) mapt-as1, (C) al451085.2, (D) otud6b-as1, (E) tnfrsf14-as1, and (F) linc01871. *p < 0.05, **p < 0.01; ** p < 0.001.
Data Sharing Statement
All the datasets displayed in this study can be obtained in the online database. Further questions can be directed to the corresponding author.