
Figures & data
Figure 1 Brief flowchart.
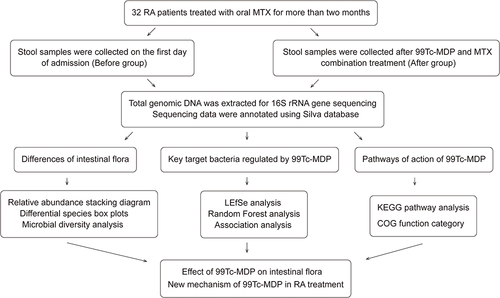
Table 1 Clinical Status Before and After Treatment
Figure 2 Compositional of gut microbes. (a) Relative abundance at the phylum level. (b) Relative abundance at the genus level.
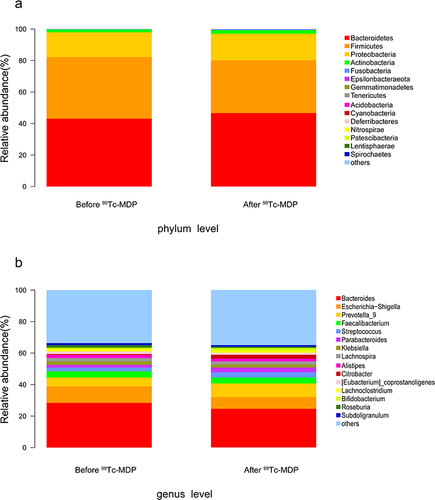
Figure 3 Statistically different species (Top 10). (a) Differential species at the phylum level. (b) Differential species at the class level. (c) Differential species at the order level. (d) Differential species at the family level. (e) Differential species at the genus level.
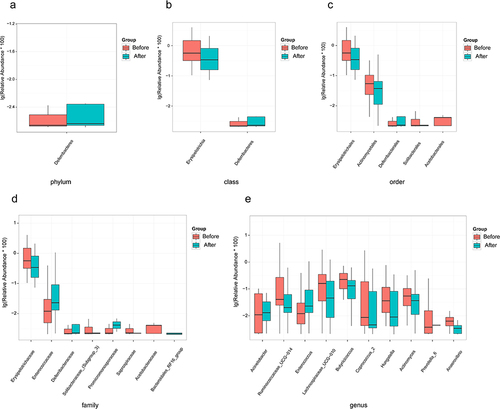
Figure 4 Biodiversity analysis. (a) Chao1 index of α-diversity. (b) Shannon index of α-diversity. (c) Bray-Curtis dissimilarity (R2=0.0129, P > 0.05). (d) Weighted UniFrac dissimilarity (R2=0.0107, P > 0.05).
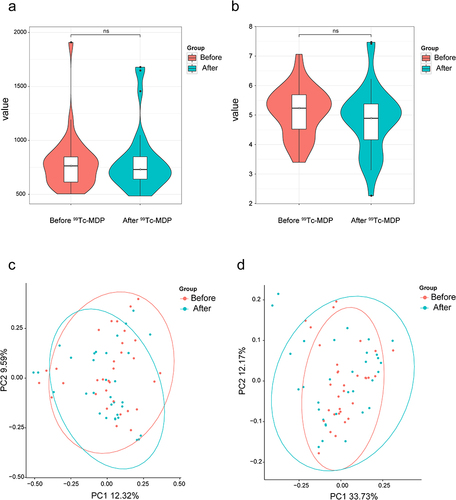
Figure 5 LEfSe analysis. (a) The magnitude of the species’ contribution to the difference. LDA SCORE indicates the magnitude of the difference contribution; the larger the absolute value, the greater the difference contribution. (b) Cladogram annotation of the differential species. Nodes at each layer indicate phylum/class/order/family/genus from the inside out. Node diameter is proportional to relative abundance. Red, rich in the Before group; Green, rich in the After group; Yellow, the difference is not significance.
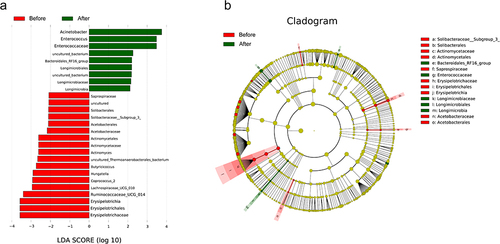
Figure 6 Targeted bacterial analyses. (a) Random Forest analysis. Mean Decrease Gini assesses the importance of the species, with higher values indicating more important species. (b) Association analysis. Red, positive correlation; Blue, negative correlation; *P < 0.05; **P < 0.01; ***P < 0.001.
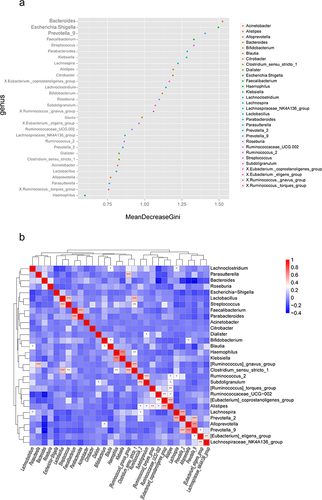
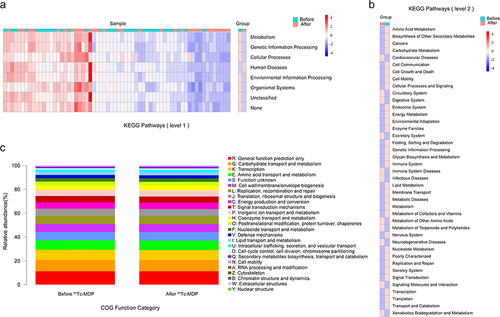
Figure 7 Functional enrichment analysis. (a) KEGG functional pathway at level 1. (b) KEGG functional pathway at level 2. (c) COG Function Category.
Data Sharing Statement
The raw sequencing data are deposited into the NCBI BioProject (http://www.ncbi.nlm.nih.gov/bioproject/871753) under accession number: PRJNA871753. The study protocol and the datasets generated during analysis during the current study will be available from the corresponding author on reasonable request.