Figures & data
Figure 1 Expression of GRHL1 in endometrial cancer and adjacent normal tissues and its prognostic assessment in endometrial cancer. (A) GRHL1 was overexpressed in the TCGA cohort. (B) In the TCGA cohort, GRHL1 was over-expressed in the tumor relative to the noncancerous tissues. (C) IHC staining analysis showed that GRHL1 expression was low in paracancerous tissues (a and b) and up-regulated in EC tissues (c–f). (D) Kaplan-Meier analysis of OS of individuals with EC with GRHL1 gene expression in the TCGA database. (E) Kaplan-Meier analysis of PFS of individuals with EC with GRHL1 gene expression in the TCGA database. (***p < 0.001).
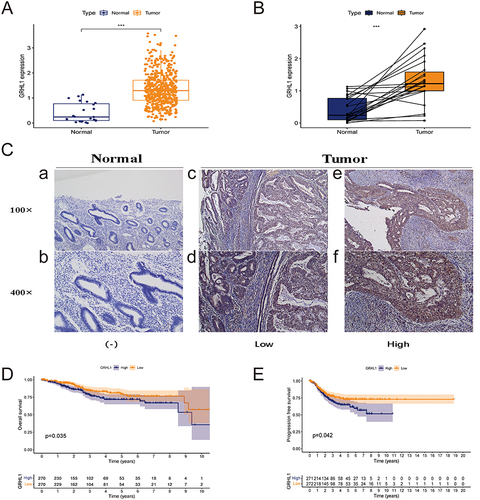
Figure 2 Association of clinicopathological characteristics with GRHL1 expression levels. (A–D) The association of GRHL1 expression level with the clinicopathological features of individuals with EC for age (A), weight (B), Grade (C), and stage (D). (E) Heatmap illustrating the link between the clinicopathological characteristics of EC patients and the GRHL1 expression. (F and G) Forest plots show the results of univariate (F) and multivariate (G) Cox regression analyses for the OS of patients with EC.
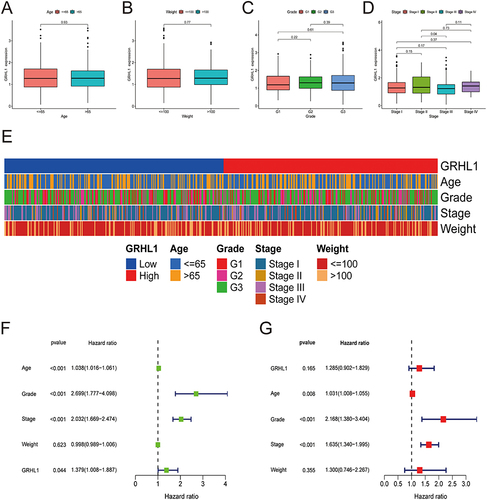
Figure 3 Correlation of GRHL1 with chemokines and tumor microenvironment in EC. (A and B) Correlation of GRHL1 with the immunomodulator chemokine (A) and its receptor (B) in EC. (C) The TME’s ESTIMATEScore, ImmuneScore, and StromalScore varied between the groups with high and low GRHL1 expression. (**p < 0.01; ***p < 0.001).
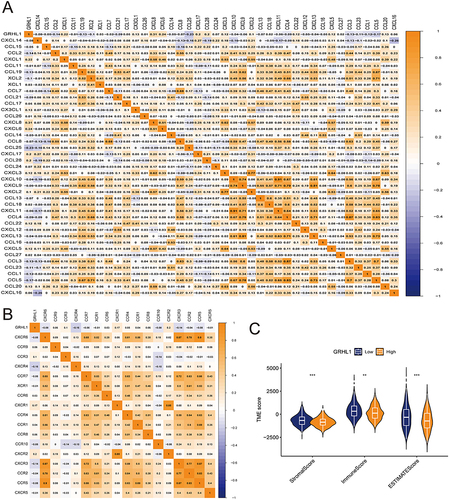
Figure 4 Link between GRHL1 and immune cell infiltration. (A) Box plots showing the differences between 22 immune cell types and GRHL1 expression analysis in EC. (B) Correlation between GRHL1 expression and 22 immune cell types in EC. (C–F) GRHL1 expression was negatively linked to CD8+ T cells (C), T cells regulatory (Tregs) (D), NK cells activated (E), Mast cells resting (F). (G–K) GRHL1 expression was positively correlated with Neutrophils (G), T cells CD4 memory resting (H), Dendritic cells activated (I), B cells naïve (J), and Mast cells activated (K). (*p < 0.05; **p <0.01; ***p < 0.001).
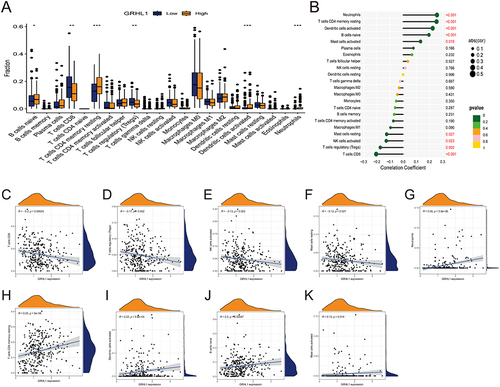
Figure 5 Investigation of the relationship between GRHL1 expression and CD8+ T cells. (A) Radar plot of correlation analysis between GRHL1 expression and CD8+ T cells. (B–H) Seven immunological algorithms were utilized to investigate the link between GRHL1 expression and CD8+ T cells: XCELL (B), QUANTISEQ (C), CIBERSORT−ABS (D), CIBERSORT (E), MCP−COUNTER (F), TIMER (G) and EPIC algorithms (H).
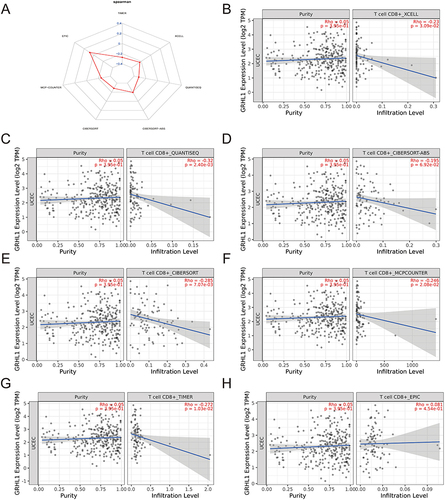
Figure 6 Immune cell infiltration in the groups with high and low GRHL1 expression. (A) CD8+ T cell (a and b) infiltration in the group with high GRHL1 expression (c and d). (B) CD8+ T cell (e and f) infiltration in the group with low GRHL1 expression (g, h). The locations of immunological cells are indicated by the red arrows.
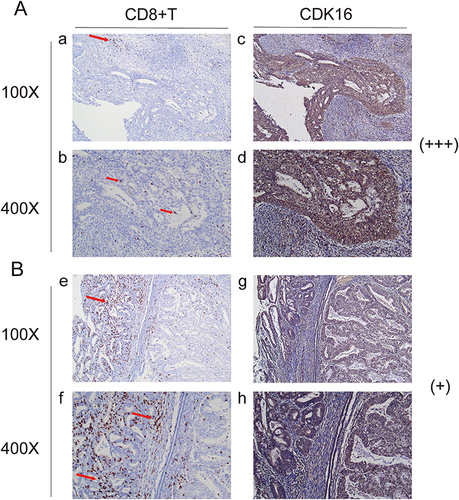
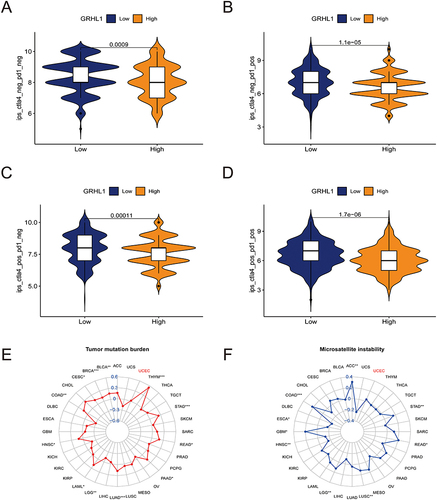
Figure 7 Correlation analysis of GRHL1 expression with TMB and MSI and evaluation of immunotherapy. (A–D) Association of IPS with the GRHL1 expression in individuals with EC based on the TCIA database; CTLA4- PD1- (A), CTLA4- PD1+ (B), CTLA4+ PD1- (C), CTLA4+PD1+ (D). (E and F) Correlation analysis of GRHL1 expression with TMB (E) and MSI (F). (*p < 0.05; **p <0.01; ***p < 0.001).