Figures & data
Table 1 Association Between NAT1 Expression and Clinicopathological Parameters in Patients with COAD
Figure 1 Expression levels of NAT1 mRNA in COAD from TIMER, TCGA and GEO databases. (A) Expression levels of NAT1 in different cancer types from TIMER database. (B) Expression of NAT1 mRNA was significantly down-regulated in COAD tumor tissues compared to normal colon tissues from the TCGA-COAD dataset. (C) Significantly decreased expression of NAT1 mRNA in COAD tumor tissues compared to adjacent paired normal colon tissues in the TCGA-COAD data. (D) GSE9348 dataset reveals a significantly lower NAT1 mRNA expression in COAD than in normal colon tissues. (E) GSE20916 dataset reveals a significantly lower NAT1 mRNA expression in COAD than in normal colon tissues.
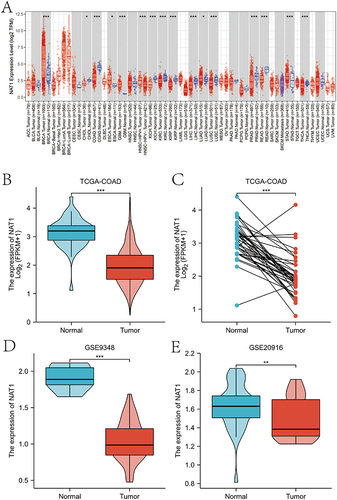
Table 2 Logistic Regression Analysis of the Relationship Between NAT1 Expression and Clinicopathological Parameters in COAD
Figure 2 Expression levels of NAT1 in COAD clinical tissues. (A-D) Expression levels of NAT1 mRNA are analyzed using the TCGA-COAD dataset based on T, N, M, and pathological stages. (E) RT-qPCR analysis is conducted on COAD tissues and adjacent paired normal colon tissues. (F) Western blot (WB) analysis is conducted on COAD tissues and adjacent paired normal colon tissues.
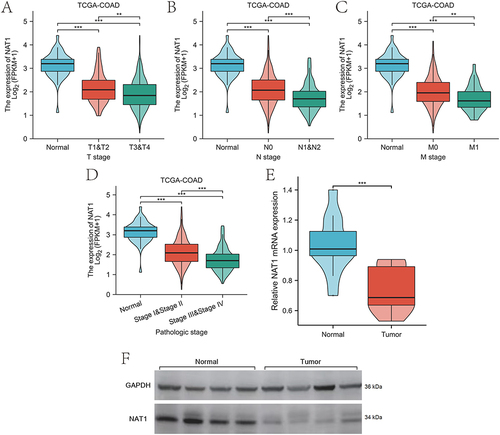
Figure 3 Diagnostic and prognostic value of NAT1 in COAD. (A) Relationship between NAT1 expression and DFS in the GSE14333 dataset. (B-D) Relationship between NAT1 expression and DFS, DSS and OS in the GSE17536 dataset. (E-G) Association of low or high NAT1 expression with OS, DSS and PFI in patients with COAD in the TCGA-COAD dataset. (H-I) ROC analysis of NAT1 in COAD, with an AUC of 0.713 (95% CI = 0.578 to 0.848) for the GSE20916 dataset and 0.912 (95% CI = 0.864 to 0.959) for the TCGA-COAD dataset.
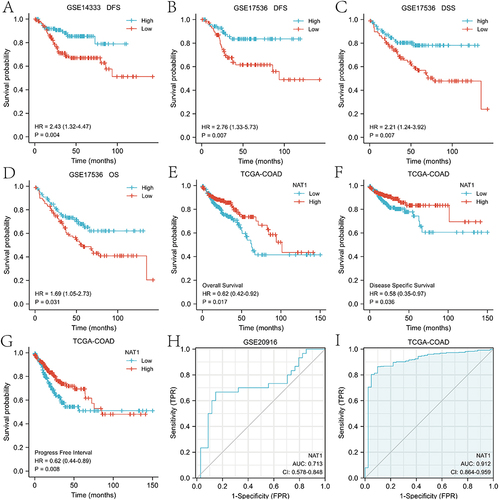
Table 3 Univariate and Multivariate Cox Regression Analyses of Clinicopathological Factors Associated with OS in Patients with COAD
Figure 4 GO and KEGG enrichment analysis of NAT1 gene. (A-C) GO enrichment analysis showing BP (biological process), CC (cellular component) and MF (molecular function) of genes co-expressed with NAT1. (D) KEGG enrichment analysis of genes co-expressed with NAT1.
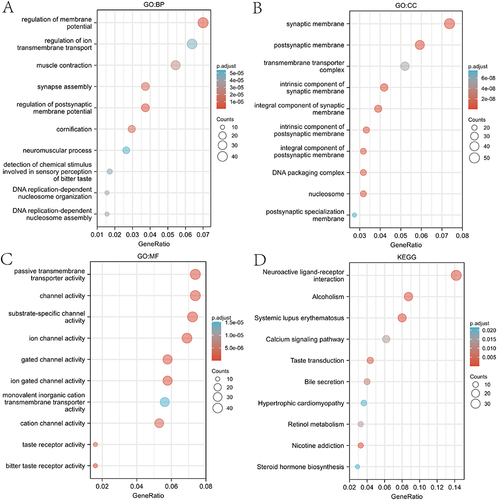
Table 4 Results of Gene Set Enrichment Analysis (GSEA) for NAT1
Figure 5 Enrichment plots from the Gene Set Enrichment Analysis (GSEA). NAT1 were significantly enriched several pathways including: (A) Neuroactive ligand-receptor Interaction, (B) Olfactory transduction, (C) Olfactory signaling pathway, (D) ECM receptor interaction, (E) Base excision repair, (F) D4GDI pathway, (G) MHC pathway, (H) CTL pathway, and (I) IL17 pathway.
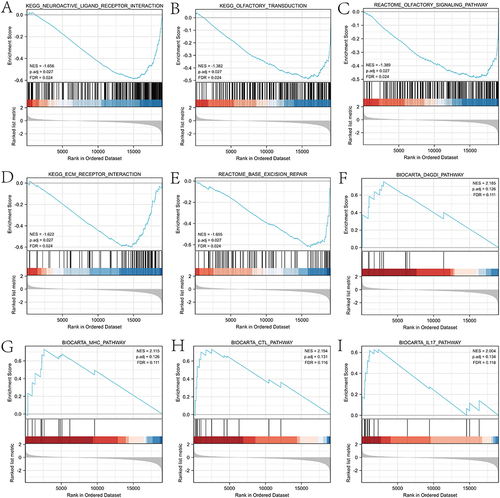
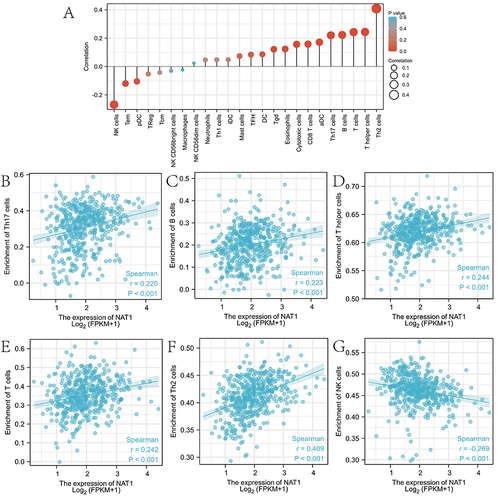
Figure 6 Association analysis of NAT1 gene expression with immune infiltration. (A) Association between NAT1 expression and 24 tumor-infiltrating lymphocytes. (B-G) Correlation of NAT1 expression with immune infiltration levels of (B) Th17 cells, (C) B cells, (D) T helper cells, (E) T cells, (F) Th2 cells, and (G) NK cells.