Figures & data
Table 1 Clinicopathological Characteristics of HCC Patients
Figure 1 CENPQ expression data in hepatocellular carcinoma (HCC). (A) Pan-cancer analysis of CENPQ mRNA expression. (B) CENPQ mRNA expression in HCC cell lines. (C) Analysis of CENPQ mRNA expression in HCC and paired non-cancerous, adjacent tissues. (D) Analysis of CENPQ mRNA expression in HCC and unpaired non-cancerous, adjacent tissues. (E) Analysis of CENPQ mRNA expression in the GEO dataset GSE 98383. (F) Analysis of CENPQ mRNA expression in the GEO dataset GSE 107170. (G) Mean integrated optical density (IOD) values of IHC images of liver and HCC. (H and I) CENPQ protein expression images in normal and HCC. *p < 0.05, **p < 0.01, ***p < 0.001.
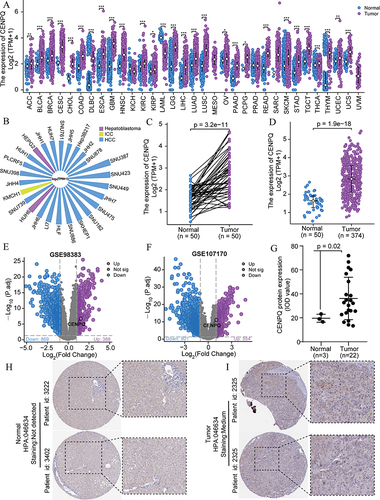
Table 2 Correlation Between CENPQ Expression and Clinicopathological Features (Logistic Regression)
Figure 2 Correlation analysis of CENPQ expression and clinicopathological features in HCC. Violin plots summarizing CENPQ expression according to weight (A), BMI (B), age (C), AFP (D), T stage (E), pathologic stage (F), histological grade (G), and prothrombin time (H).

Figure 3 Diagnostic and prognostic value of CENPQ in HCC. (A) ROC analysis indicating good diagnostic performance of CENPQ mRNA profiling in distinguishing HCC samples from normal liver tissue. Kaplan-Meier curves showing the relationship between CENPQ expression and OS (B), DSS (C), and PFI (D). (E–H) Kaplan-Meier curves of OS in subgroups of HCC patients. (E) Age, >60 and ≤60 years, (F) weight, ≤70 and >70 kg, (G) gender, male and female, (H) pathological stage, T2-T4 and T1.
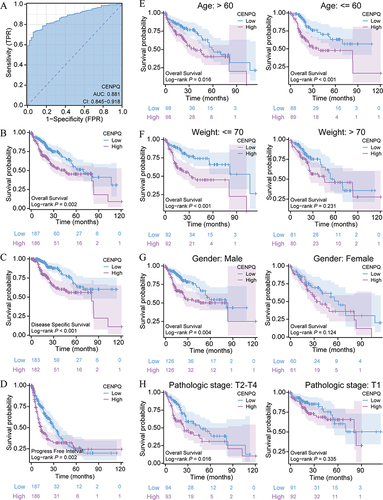
Figure 4 Univariate and multivariate Cox regression analyses of prognostic-related risk factors. Univariate and multivariate Cox regression analyses of risk factors associated with OS (A), DSS (B), and PFI (C) in HCC.
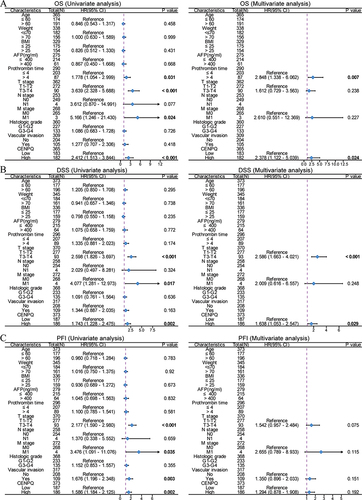
Figure 5 Identification of CENPQ-related DEGs in HCC and functional and pathway enrichment analyses. (A) Volcano plot of the distribution of DEGs. (B) BP, CC, MF, and KEGG terms for enrichment analysis of DEGs. (C and D) gene set enrichment analysis of DEGs.
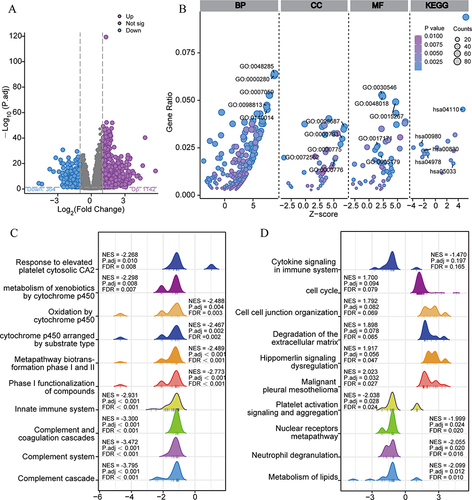
Figure 6 Correlation analysis of CENPQ expression and immune cell infiltration in HCC. (A) Correlation between CENPQ expression and the abundance of 24 tumor-infiltrating immune cell types. (B) Chord plot depicting the correlation between CENPQ and the abundance of 16 tumor-infiltrating immune cell types. Enrichment scores of positively correlated (C) and negatively correlated (D) immune cells in the CENPQ high and low expression groups.
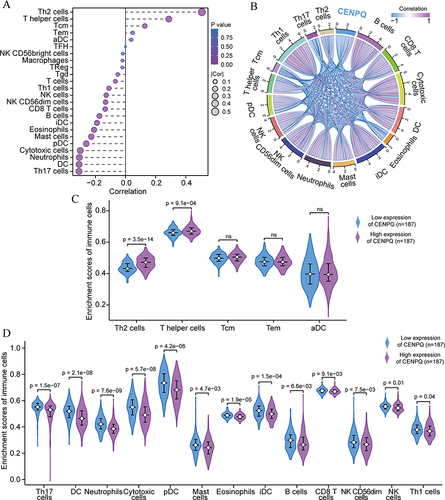
Figure 7 Correlation analysis of CENPQ expression and immune checkpoint genes in HCC. CENPQ was positively correlated with PD-L1 (A), HAVCR2 (B), PD1 (C), CTLA4 (D), SIGLEC15 (E), PDCD1LG2 (F), LAG3 (G) and TIGIT (H). (I) Heat map depicting the correlation of CENPQ with 8 immune checkpoint genes in HCC. *p < 0.05, **p < 0.01, ***p < 0.001.
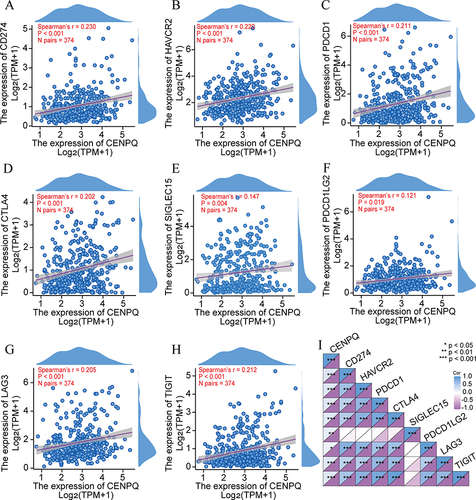
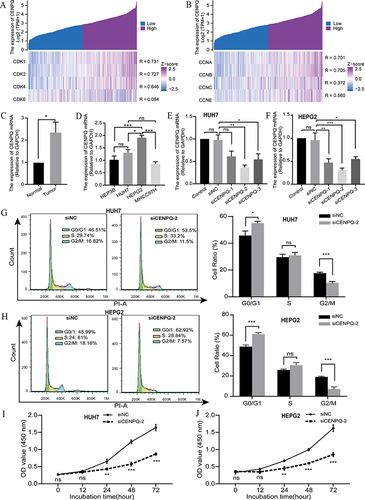
Figure 8 CENPQ is involved in the regulation of HCC cell cycle and proliferation. (A) Heatmap of the correlation between CENPQ and CDK gene family (CDK1, CDK2, CDK4, CDK6). (B) Heatmap of the correlation between the expression of CENPQ and CCNA, CCNB, CCNC, and CCNE. (C) Expression of CENPQ mRNA in HCC and normal liver tissues. (D) Expression of CENPQ mRNA in HCC cell lines. Silencing of CENPQ in HCC cell lines HUH7 (E) and HEPG2 (F). Flow cytometry was used to detect cycle changes in HUH7 (G) and HEPG2 (H). CCK-8 was used to detect viability changes of HUH7 (I) and HEPG2 (J).*p < 0.05, **p < 0.01, ***p < 0.001.