
Figures & data
Figure 1 Allelic discrimination plot for the delGAT/GAT polymorphic SNP rs72552763.
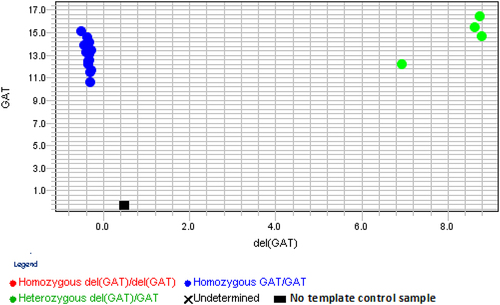
Table 1 General Characteristics of the Metformin Intolerance Study Participants (n = 47)
Figure 2 Independent-Samples Mann–Whitney U-test between metformin tolerant and intolerant groups on their baseline FBG (panel (A) and HbA1c levels (panel (B).
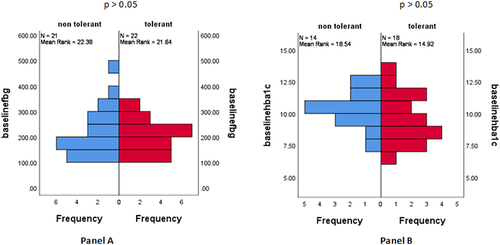
Table 2 Genotype and Allele Frequency Distribution of the rs72552763 Polymorphism Across Intolerance Study Participants (n = 47)
Table 3 Logistic Regression Analysis on the Predictors of Metformin Intolerance Among Study Participants (n = 47)
Table 4 Chi-Square Test Analysis on the Effect of the Alleles of the rs72552763 Polymorphism on Metformin Intolerance Among Study Participants (n = 47)