
Figures & data
Figure 1 Identification of differentially expressed genes.
Notes: (A) Boxplots before expression profile homogenization. (B) Boxplots after expression profile homogenization. (C) Volcano plots of DEGs from GSE83452. (D) Heatmap of top 20 DEGs from GSE83452.
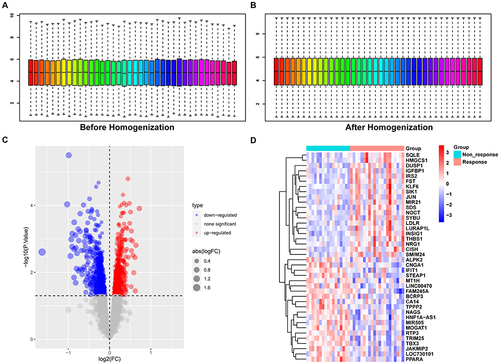
Figure 2 Enrichment analysis of DEGs.
Notes: (A–C) GO enrichment analysis of DEGs, including BP (A), CC (B), and MF (C). (D) KEGG analysis of DEGs. The top 20 terms were displayed.
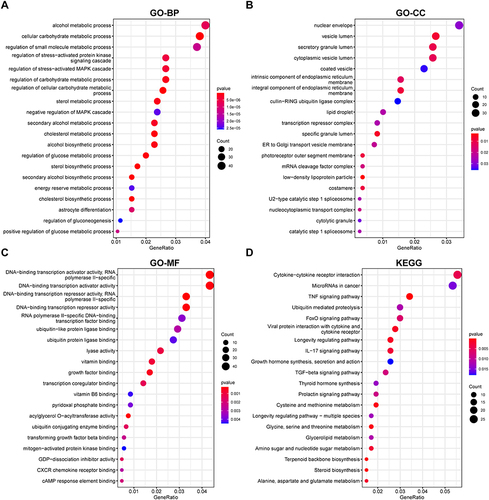
Figure 3 Identification of glycosylation-related DEGs.
Notes: (A and B) Identification of glycosylation-related among DEGs. Venn diagram demonstrating up-regulated and down-regulated glycosylation-related genes. (C) KEGG analysis of glycosylation-related DEGs. The top 20 terms were displayed. (D) The correlation of top 5 KEGG terms and corresponding genes.
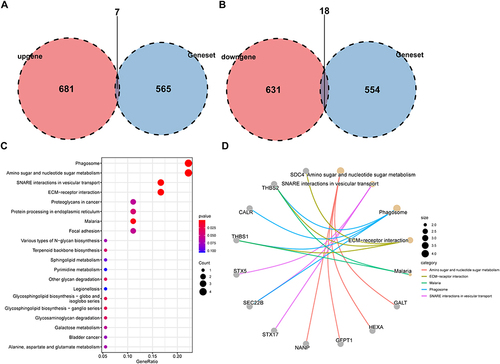
Figure 4 Exhibition of glycosylation-related DEGs.
Notes: (A) Volcano plots of glycosylation-related DEGs from GSE83452. (B) Heatmap of glycosylation-related DEGs from GSE83452. (C) Differential expression of glycosylation-related DEGs between non-response and response groups, *P <0.05, **P <0.01.
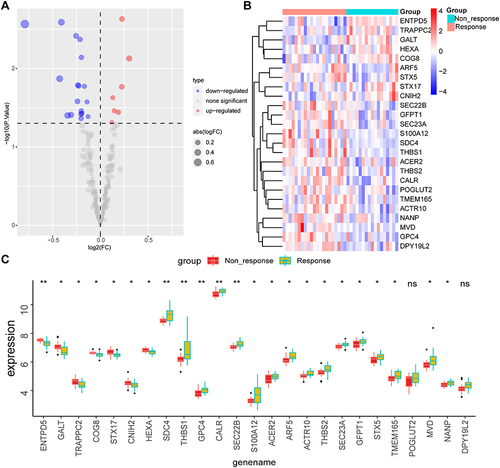
Figure 5 PPI network for DEGs.
Note: (A and B) The PPI network was constructed by glycosylation-related DEGs using STRING and the GeneMANIA database.
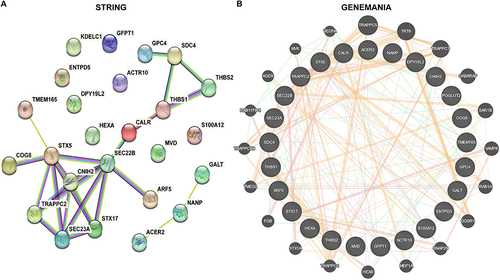
Figure 6 Selection of hub genes via machine learning.
Notes: (A–C) Three algorithms were utilized for screening hub genes among key glycosylation-related DEGs, including the LASSO algorithm (A), random forest algorithm (B), and SVM-RFE algorithm (C). (D) Intersection of hub genes between three indicated machine learning algorithms. (E) Correlation of 7 hub genes. The red line represents a positive correlation, green represents a negative correlation, and the deeper the color, the stronger the correlation. (F) Diagnostic efficacy of the 7 hub genes in GSE83452.
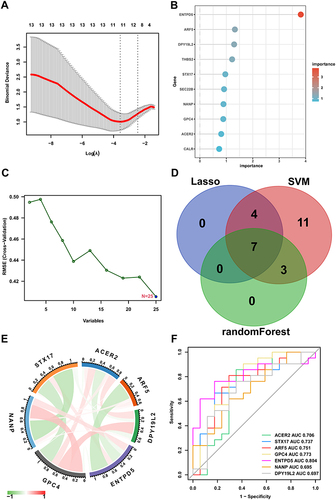
Figure 7 The correlation analysis of immune cell infiltration.
Notes: (A) The correlation between each immune cell. (B) Immune cell infiltration difference between indicated groups. (C) The correlation of immune cell infiltration level with indicated hub genes. Only significant results (P < 0.05) were displayed, *P <0.05, **P <0.01.
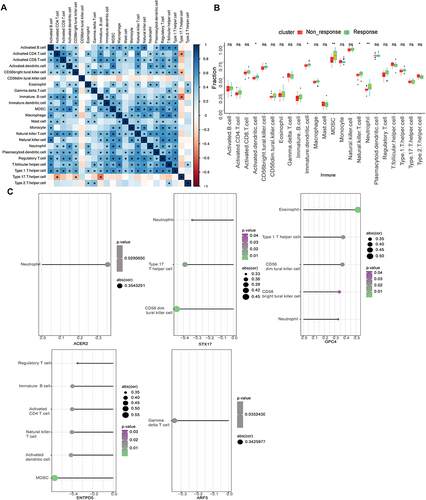
Figure 8 The Co-expression analysis of hub genes.
Note: The top 50 genes most positively associated with indicated hub genes were shown in the heatmap.
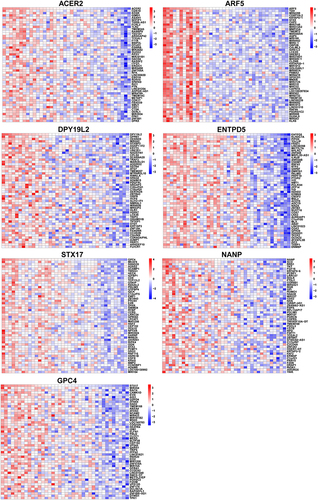
Figure 9 GSEA of hub genes.
Note: The top 20 terms of GSEA results of indicated hub genes were shown.
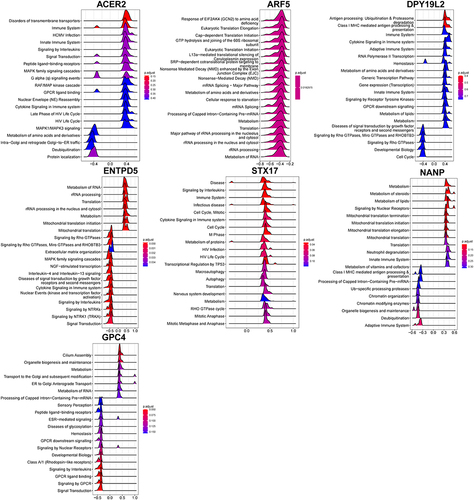
Figure 10 Establishment of the miRNA-TF-genes network.
Note: The RegNetwork database was utilized to identify upstream miRNAs and TFs of the 7 hub genes.
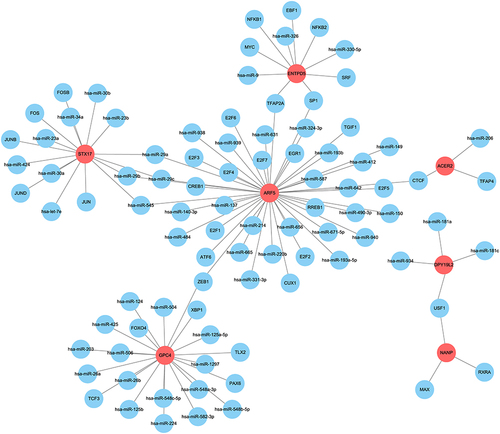
Figure 11 Validation of glycosylation-related hub genes.
Notes: (A) Boxplots before expression profile homogenization. (B) Boxplots after expression profile homogenization. (C) Volcano plots of DEGs from GSE89632. (D) Heatmap of top 20 DEGs from GSE89632. (E) GO enrichment analysis of DEGs. (F) KEGG analysis of DEGs. The top 20 terms were displayed. (G) The difference of glycosylation-related hub genes in indicated groups, **P <0.01, ***P <0.001.
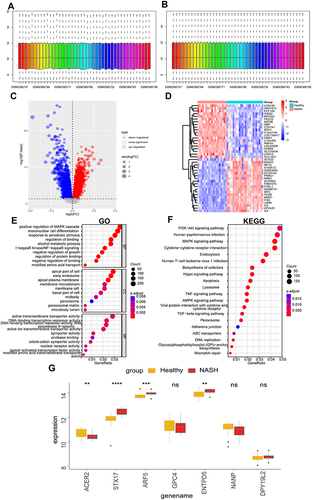
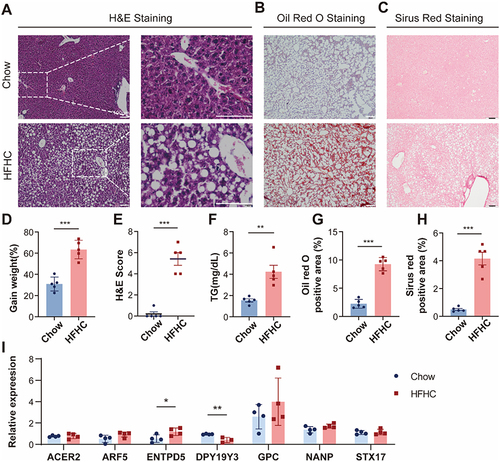
Figure 12 Validation of hub genes in HFHC mice.
Notes: (A) H&E staining images of two groups of mice. Images of oil red O staining and sirius red staining are shown in (B and C). (D) Weight gain of two groups of mice. (E) The quantitative indicators of H&E staining. (F) TG levels of two groups of mice at the end of the modeling time. (G and H) The quantitative indicators of Oil Red O staining and Sirius Red staining in the two groups of mice. (I) ENTPD5 showed increased transcription in obese mice, while DPY19Y3 exhibited decreased transcription, consistent with our previous predictions. Statistical significance was considered at *P <0.05, **P <0.01 ***P <0.001.
Data Sharing Statement
Raw data of this study are available from the corresponding author Xiujun Cai upon request.