
Figures & data
Figure 1 Assay methodology overview.
Abbreviations: FSC, forward scatter; SSC, side scatter.
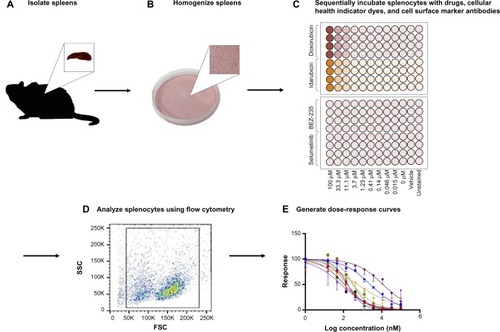
Figure 2 Flow cytometry gating strategy.
Abbreviations: AmCyan, Anemonia majano cyan fluorescent protein; APC, allophycocyanin; Cy, cyanine; FITC, fluorescein isothiocyanate; FSC, forward scatter; PE, phycoerythrin; PerCP, peridinin-chlorophyll proteins; SSC, side scatter.
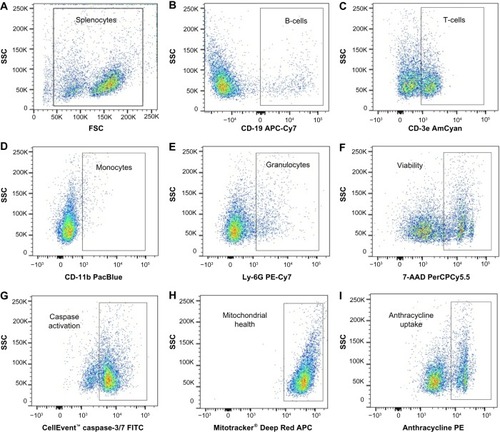
Table 1 Multiparameter flow cytometry assay
Figure 3 Interstrain variation of viability across immune cell types and anticancer drugs.
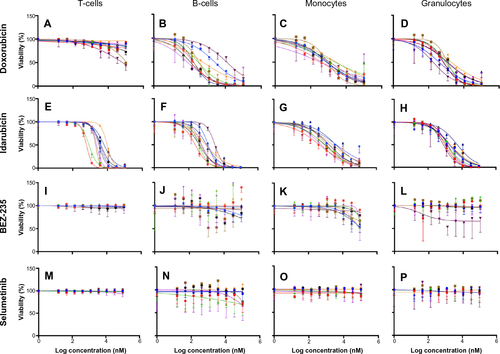
Figure 4 Replicability of dose-response curves.
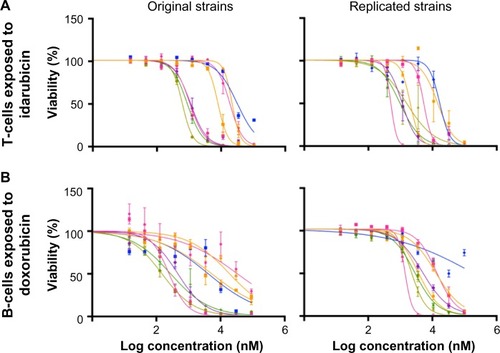
Figure 5 Interstrain phenotype comparisons for log10 (IC50 [nM]).
Abbreviation: IC50, half maximal inhibitory concentration.
![Figure 5 Interstrain phenotype comparisons for log10 (IC50 [nM]).](/cms/asset/2f4e32ba-2571-47d9-9d2e-c9dbafd97316/dpgp_a_73312_f0005_c.jpg)
Table 2 Phenotype correlations for log10 (IC50 [nM]) values across strains
Figure S1 Cellular subpopulations of freshly isolated splenocytes.
Notes: Splenocytes were isolated from male C57BL/6J (n=4) mice. Our populations were comparable to murine spleen cell composition when available in the Mouse Phenome Database (B-cells, granulocytes, and monocytes P<0.05 using t-tests).
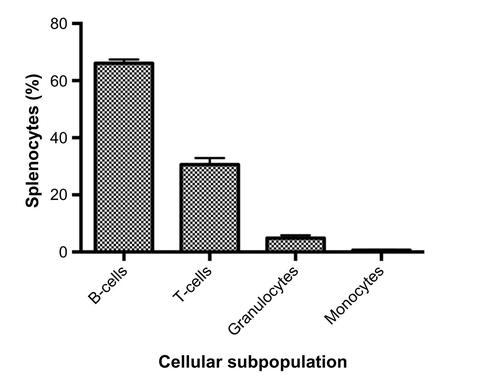
Figure S2 Interstrain variation of viability across immune cell types and anticancer drugs.
Notes: Dose-response curves depict cell populations (columns, ie, T-cells [A, E, I, and M], B-cells [B, F, J, and N], monocytes [C, G, K, and O], and granulocytes [D, H, L, and P]) exposed to anticancer drugs (rows, ie, doxorubicin [A-D], idarubicin [E-H], BEZ-235 [I-L], and selumetinib [M-P]). Thirty-six strains are included: 129S1/SvImJ, 129X1/SvJ, A/J, AKR/J, BALB/cByJ, BTBR T+ Itpr3tf/J, BUB/BnJ, C3H/HeJ, C57BLKS/J, C57BL/6J, C57BR/cdJ, C58/J, CBA/J, CZECHII/EiJ, DBA/2J, FVB/NJ, I/LnJ, KK/HiJ, LG/J, LP/J, MA/MyJ, NOD/LtJ, NON/LtJ, NZB/BINJ, NZO/HiLtJ, NZW/LacJ, PERA/EiJ, PL/J, PWD/PhJ, PWK/PhJ, RIIIS/J, SEA/GnJ, SJL/J, SM/J, SWR/J, and WSB/EiJ.
Abbreviations: AUC, area under the curve; IC50, half maximal inhibitory concentration.
![Figure S2 Interstrain variation of viability across immune cell types and anticancer drugs.Notes: Dose-response curves depict cell populations (columns, ie, T-cells [A, E, I, and M], B-cells [B, F, J, and N], monocytes [C, G, K, and O], and granulocytes [D, H, L, and P]) exposed to anticancer drugs (rows, ie, doxorubicin [A-D], idarubicin [E-H], BEZ-235 [I-L], and selumetinib [M-P]). Thirty-six strains are included: 129S1/SvImJ, 129X1/SvJ, A/J, AKR/J, BALB/cByJ, BTBR T+ Itpr3tf/J, BUB/BnJ, C3H/HeJ, C57BLKS/J, C57BL/6J, C57BR/cdJ, C58/J, CBA/J, CZECHII/EiJ, DBA/2J, FVB/NJ, I/LnJ, KK/HiJ, LG/J, LP/J, MA/MyJ, NOD/LtJ, NON/LtJ, NZB/BINJ, NZO/HiLtJ, NZW/LacJ, PERA/EiJ, PL/J, PWD/PhJ, PWK/PhJ, RIIIS/J, SEA/GnJ, SJL/J, SM/J, SWR/J, and WSB/EiJ.Abbreviations: AUC, area under the curve; IC50, half maximal inhibitory concentration.](/cms/asset/db2fd1fe-af88-4847-997f-7d74ad1d46a2/dpgp_a_73312_sf0002_c.jpg)
Figure S3 Interstrain phenotype comparisons for area under the curve.
Notes: Area under the curve values across strains, heritability, and correlation to log10 (IC50 [nM]) values, when relevant, are displayed for T-cells exposed to selumetinib (A), T-cells exposed to BEZ-235 (B), T-cells exposed to doxorubicin (C), T-cells exposed to idarubicin (D), B-cells exposed to selumetinib (E), B-cells exposed to BEZ-235 (F), B-cells exposed to doxorubicin (G), B-cells exposed to idarubicin (H), monocytes exposed to selumetinib (I), monocytes exposed to BEZ-235 (J), monocytes exposed to doxorubicin (K), and monocytes exposed to idarubicin (L). Strains are arranged from largest to smallest area under the curve (±SEM) along the X-axis. Abbreviations: AUC, area under the curve; IC50, half maximal inhibitory concentration; SEM, standard error of the mean.
![Figure S3 Interstrain phenotype comparisons for area under the curve.Notes: Area under the curve values across strains, heritability, and correlation to log10 (IC50 [nM]) values, when relevant, are displayed for T-cells exposed to selumetinib (A), T-cells exposed to BEZ-235 (B), T-cells exposed to doxorubicin (C), T-cells exposed to idarubicin (D), B-cells exposed to selumetinib (E), B-cells exposed to BEZ-235 (F), B-cells exposed to doxorubicin (G), B-cells exposed to idarubicin (H), monocytes exposed to selumetinib (I), monocytes exposed to BEZ-235 (J), monocytes exposed to doxorubicin (K), and monocytes exposed to idarubicin (L). Strains are arranged from largest to smallest area under the curve (±SEM) along the X-axis. Abbreviations: AUC, area under the curve; IC50, half maximal inhibitory concentration; SEM, standard error of the mean.](/cms/asset/e9ca59d1-6432-42e5-bbe1-6004450a0d9d/dpgp_a_73312_sf0003_b.jpg)
Figure S4 Interstrain phenotype comparisons for slope coefficients.
Notes: Slope coefficients across strains and correlation to log10 (IC50 [nM]) values are displayed for T-cells exposed to idarubicin (A), B-cells exposed to doxorubicin (B), B-cells exposed to idarubicin (C), monocytes exposed to doxorubicin (D), and monocytes exposed to idarubicin (E). Strains are arranged from largest to smallest slope coefficient (±SEM) along the X-axis.
Abbreviations: IC50, half maximal inhibitory concentration; SEM, standard error of the mean.
![Figure S4 Interstrain phenotype comparisons for slope coefficients.Notes: Slope coefficients across strains and correlation to log10 (IC50 [nM]) values are displayed for T-cells exposed to idarubicin (A), B-cells exposed to doxorubicin (B), B-cells exposed to idarubicin (C), monocytes exposed to doxorubicin (D), and monocytes exposed to idarubicin (E). Strains are arranged from largest to smallest slope coefficient (±SEM) along the X-axis.Abbreviations: IC50, half maximal inhibitory concentration; SEM, standard error of the mean.](/cms/asset/018fca56-80e6-49b3-93e5-896678567653/dpgp_a_73312_sf0004_b.jpg)
Table S1 Heritability (%) of viability (%) at specific drug doses (μM) among different phenotypes
Table S2 Phenotype correlations for area under the curve values across strains
Table S3 Phenotype correlations for slope coefficient values across strains