
Figures & data
Figure 1 Flow diagram showing the design of the RIBADOS study, with the number of patients included and reasons for discontinuation of intervention.
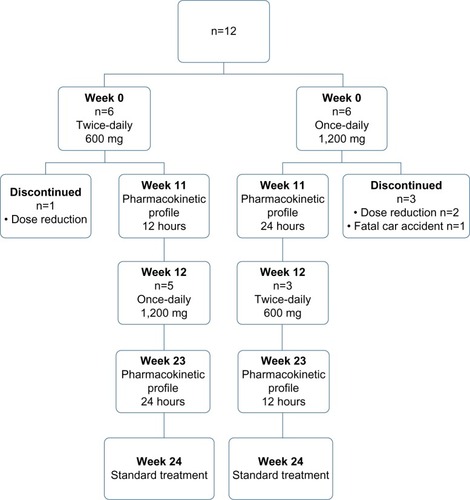
Figure 2 LC-MS/MS RBV analysis in blood plasma.
Abbreviations: CID, collision-induced dissociation; ESI, electrospray ionization; frag, fragmentation; IS, internal standard; LC-MS/MS, liquid chromatography-tandem mass spectrometry; Mol, molecular; MRM, multiple reaction monitoring; RBV, ribavirin; wt, weight.
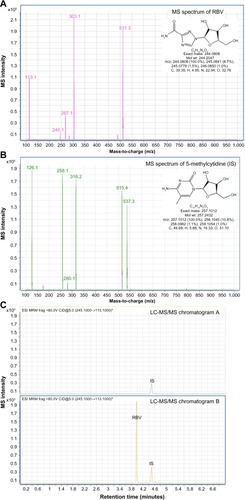
Table 1 Patient characteristics and hematological parameters at the start of the treatment
Figure 3 Typical pharmacokinetic profile for RBV in one patient. The first blood sample was taken before intake of the prescribed dose of RBV. The intake is at time zero. In the twice-daily dose regimen, the RBV plasma concentrations were monitored for 12 hours (solid line). In the once-daily dose regimen, the RBV plasma concentrations were monitored for 24 hours (dashed line).
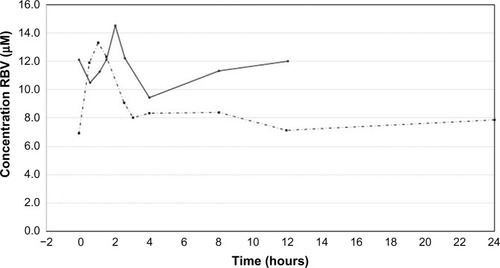
Figure 4 Pharmacokinetic parameters for RBV.
Abbreviations: AUC, area under the concentration-time curve; Cmax, maximum concentration; Cmin, minimum concentration; RBV, ribavirin.
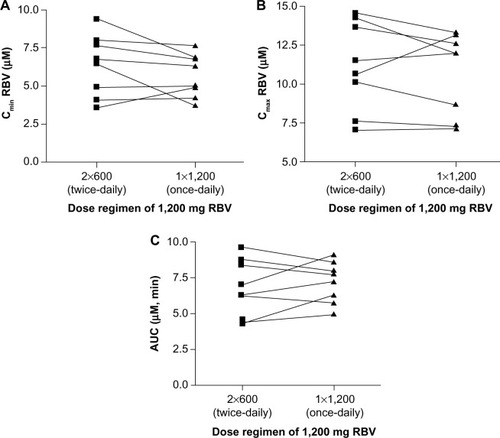
Table 2 Change in hematological parameters after 4 weeks of treatment