
Figures & data
Figure 1 Study flow diagram.
Abbreviations: CCBRT, Comprehensive Community Based Rehabilitation in Tanzania; KCMC, Kilimanjaro Christian Medical Centre.
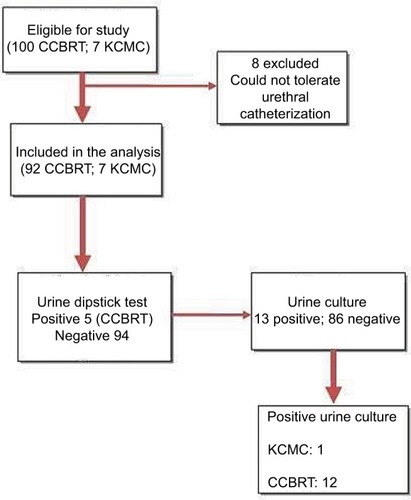
Table 1 Demographic characteristics of the study participants (N=99)
Table 2 Clinical characteristics of the study participants (N=99)
Table 3 Association between some characteristics of participants with cerebral palsy and presence of urinary tract infection (UTI)
Table 4 Antimicrobial drug sensitivity patterns of the isolated organisms (n=13)