Figures & data
Figure 1 Flowchart for inclusion of the studies in the systematic review and meta-analysis.
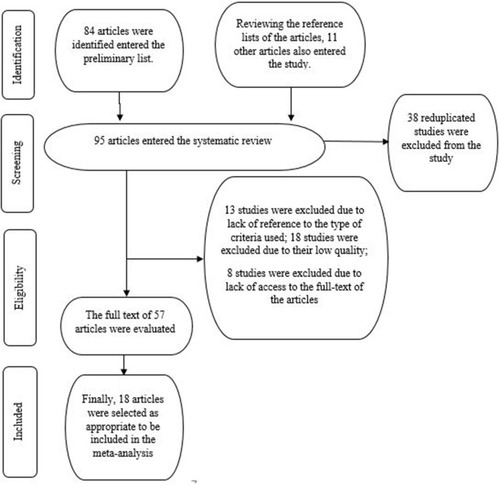
Table 1 Overall Data of the Selected Studies in This Meta-Analysis
Table 2 The Relationship Between the Concentrations of Copper, Lead, and Mercury and Autism in Terms of Number and Type of Studies Included in the Meta-Analysis
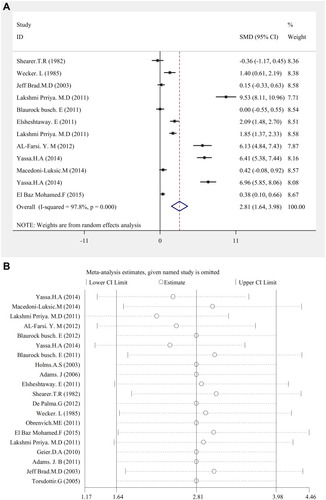
Figure 2 (A) cu Forest plots for the studies Cu concentration statuses combination difference between autistic patients and healthy individuals. The area of each square is proportional to the percentage weight of each individual study in the meta-analysis (CI 95%). In this chart, studies are stored in order of year publication and author’s names, based on a random effects model. (B) cu. Sensitivity analysis for studies in overall study copper for autism patients versus healthy controls. (C) cu. Begg’s funnel plot for publication bias in the risk difference (RD) analysis. The diameter of each circle represents the weight in the meta-analysis.
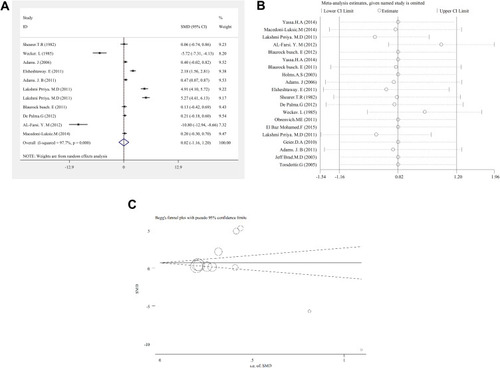
Figure 3 (A) Hg, Forest plots for the studies Hg statuses combination difference between autistic patients and healthy individuals. The area of each square is proportional to the percentage weight of each individual study in the meta-analysis (CI 95%). In this chart, studies are stored in order of year publication and author’s names, based on a random effects model. (B) Hg. Sensitivity analysis for studies in overall study for autism patients versus healthy controls.
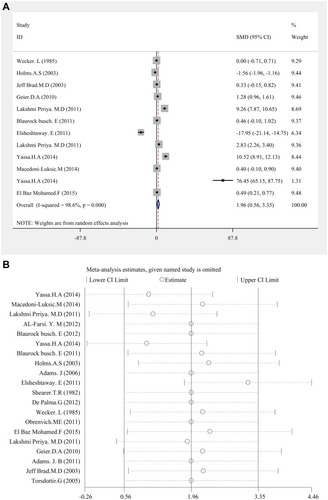
Figure 4 (A) Pb. Forest plots for the studies Pb statuses combination difference between autistic patients and healthy individuals. The area of each square is proportional to the percentage weight of each individual study in the meta-analysis (CI 95%). In this chart, studies are stored in order of year publication and author’s names, based on a random effects model. (B) Pb. Sensitivity analysis for studies in overall study for autism patients versus healthy controls.