
Figures & data

Table 1 cUTI Definition Used for Classification in This Review
Table 2 Final Calibrated Parameter Search for This Review
Figure 1 PRISMA flow diagram for this UTI guideline scoping review.
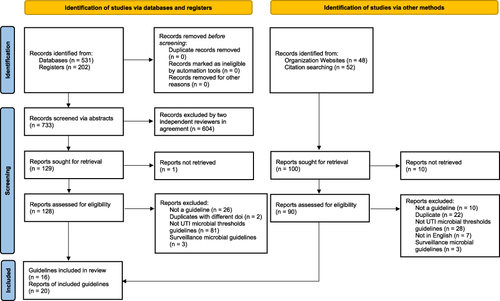
Figure 2 Complicated UTI (cUTI) microbial threshold recommendations by geographical region; CAUTI not included. The vertical axes indicate the region and number of guidelines. The horizontal axes indicate the number of recommendations. Guidelines often included more than one recommendation. Microbial thresholds in CFU/mL are indicated by color (none = navy blue, any count = yellow, 101 = pink, 102 = orange, 103 = light blue, 104 = green, 105 = Oxford blue, and no consensus = khaki). Definition of cUTI used is outlined in .
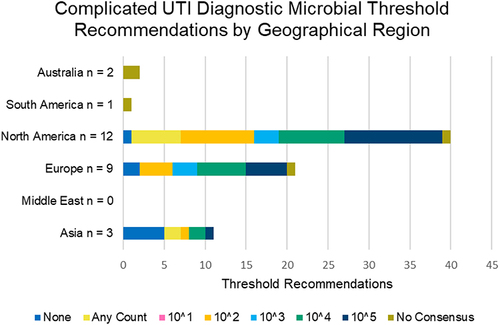
Figure 3 Complicated UTI (cUTI) diagnostic microbial threshold recommendations by time period; CAUTI not included. The vertical axes indicate the eight-year time periods and the number of guidelines. The horizontal axes indicate the total recommendations from all guidelines. Microbial thresholds in CFU/mL are indicated by color (none = navy blue, any count = yellow, 101 = pink, 102 = orange, 103 = light blue, 104 = green, 105 = Oxford blue, and no consensus = khaki).
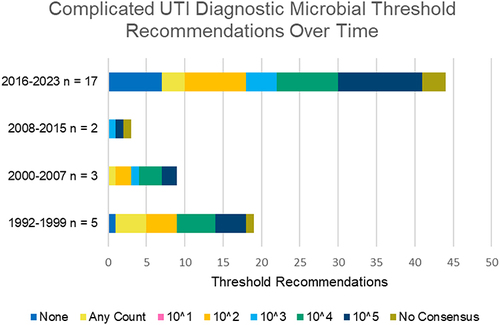
Figure 4 Complicated UTI (cUTI) Diagnostic Microbial Threshold Recommendations by Diagnosis; CAUTI not included - Comparison Between Older and Newer Guidelines. The vertical axes indicate the number of guidelines per diagnosis group/time period. The horizontal axes indicate the percent of the total recommendations for that diagnosis group/time period. Microbial thresholds in CFU/mL are indicated by color (none = navy blue, any count = yellow, 101 = pink, 102 = orange, 103 = light blue, 104 = green, 105 = Oxford blue, and no consensus = khaki). rUTI = recurrent Urinary Tract Infection.
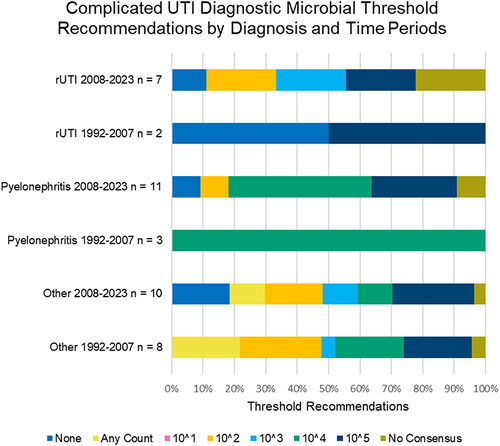
Figure 5 Complicated UTI (cUTI) diagnostic microbial threshold recommendations by specimen collection method; CAUTI not included. The vertical axes indicate the collection method and number of guidelines. The horizontal axes indicate the percent of the total recommendations for each collection method. Microbial thresholds in CFU/mL are indicated by color (none = navy blue, any count = yellow, 101 = pink, 102 = orange, 103 = light blue, 104 = green, 105 = Oxford blue, and no consensus = khaki). The “indwelling catheter” collection method includes collection via indwelling suprapubic catheter.
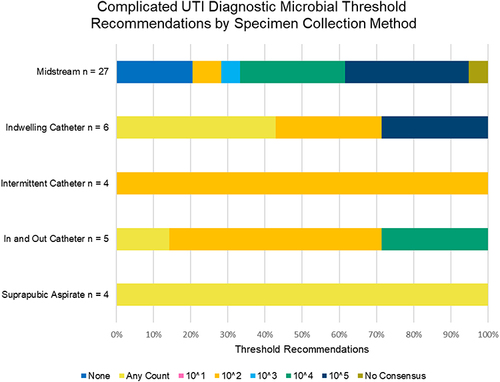
Figure 6 Complicated UTI (cUTI) Midstream Specimen Diagnostic Microbial Threshold Recommendations by Sex and Risk for Cystitis. The vertical axes indicate the sex-risk group and number of guidelines. The horizontal axes indicate the percent of the total recommendations for each group. Microbial thresholds in CFU/mL are indicated by color (none = navy blue, any count = yellow, 101 = pink, 102 = orange, 103 = light blue, 104 = green, 105 = Oxford blue, and no consensus = khaki). High risk patients in the at risk categories included solid organ transplant, spinal cord injury, intensive care unit, and long-term care patients.
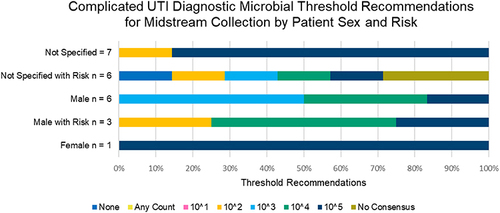
Table 3 Quality of Evidence – References Most Frequently Cited as Justification in the Guidelines