Figures & data
Table 1 Demographic Characteristics of Analysed Specimens
Figure 1 Flow chart of specimen.
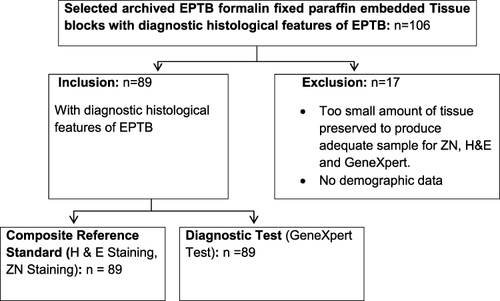
Table 2 Test Results for H&E, ZN and GeneXpert
Table 3 Test Results for ZN, H&E and GeneXpert by Sex, Age and Tissue Types
Table 4 Overall Contingence Table for All Tissues
Table 5 Contingence Table for Lymph Node and Non Lymph Node Tissues
Table 6 Diagnostic Utility of GeneXpert Against ZN and H&E as Composite Reference Standard
Table 7 Diagnostic Utility of GeneXpert by Tissue Type Against ZN and H&E as Composite Reference Standard
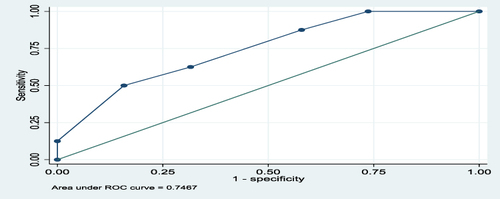
Figure 2 Area under ROC curve for all Tissues.
Abbreviation: ROC, Receiver operating characteristic curve.
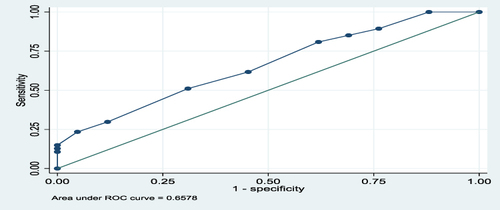
Figure 3 Area under ROC curve for Lymph node Tissues.
Abbreviation: ROC, Receiver operating characteristic curve.
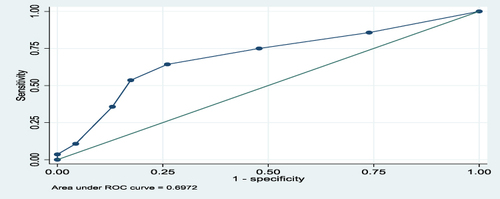
Figure 4 Area under ROC curve for non-lymph node Tissues.
Abbreviation: ROC, Receiver operating characteristic curve.