
Figures & data
Table 1 Baseline demographic and clinical characteristics of patients
Table 2 Demographic and baseline covariates included in the propensity score estimation
Figure 1 Standardized differences between cohorts in key baseline characteristics for the unmatched dataset, exact matching, propensity score matching, and the pseudo-dataset weighted by the stabilized IPTW. Absolute standardized differences in the unmatched dataset extended to 0.375, and for the exact-matched dataset, standardized differences were outside of the ±0.1 interval defining balance for allergy prescriptions, asthma-related hospital admissions, evidence of rhinitis, and evidence of GERD. All standardized differences were within ±0.1 for the datasets matched on propensity score and the pseudo-dataset weighted by IPTW.
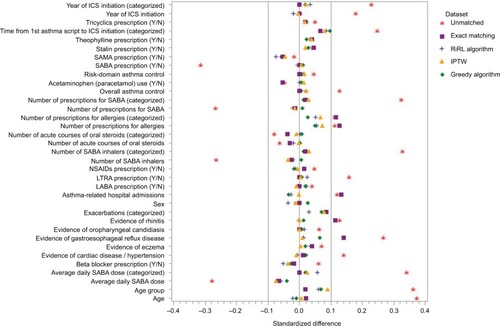
Figure 2 Comparison of outcomes using exact matching and propensity score methods.
Notes: (A) Results for comparison of exacerbation rates using exact matching and propensity score methods. aAdjusted for propensity score and baseline exacerbations (0/≥1). bAdjusted for age group and baseline exacerbations (0/≥1). cAdjusted for evidence of GERD and baseline exacerbations (0/≥1). dAdjusted for baseline exacerbations (0/≥1). Comparison of rate ratios (95% CIs) for severe exacerbation rates estimated using a Poisson regression model. (B) Results for comparison of risk-domain asthma control using exact matching and propensity score methods. aAdjusted for propensity score and baseline RDAC status. bAdjusted for the evidence of GERD and baseline RDAC status. cAdjusted for age group, evidence of GERD, and time from first asthma prescription. dAdjusted for evidence of GERD. Odds ratios compare ciclesonide versus the fine-particle ICS cohort (the latter set at odds=1.0). Odds ratios (95% CIs) for risk-domain asthma control estimated using a logistic regression model. (C) Results for comparison of overall asthma control using exact matching and propensity score methods. aAdjusted for propensity score, baseline RDAC status, and time from first asthma prescription. bAdjusted for evidence of GERD, leukotriene receptor antagonist use, baseline average daily SABA dose (categorized) and baseline RDAC status. cAdjusted for age group, evidence of GERD, baseline average daily SABA dose (categorized) and baseline RDAC status. dAdjusted for evidence of GERD and baseline overall asthma control. eAdjusted for evidence of GERD, baseline average daily SABA dose (categorized as 0/1–100/101–200/>200 μg) and baseline RDAC status. Odds ratios compare ciclesonide versus the fine-particle ICS cohort (the latter set at odds =1.0) and were estimated using a logistic regression model. (D) Results for comparison of change in therapy using exact matching and propensity score methods. aAdjusted for evidence of rhinitis and evidence of GERD. bAdjusted for evidence of GERD. cAdjusted for evidence of rhinitis. Odds ratios compare ciclesonide versus the fine-particle ICS cohort (the latter set at odds=1.0). Odds ratios (95% CIs) for change in therapy estimated using a logistic regression model.
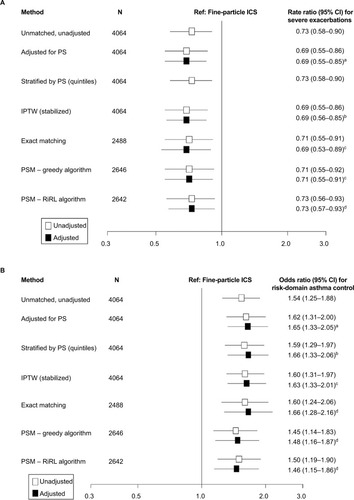
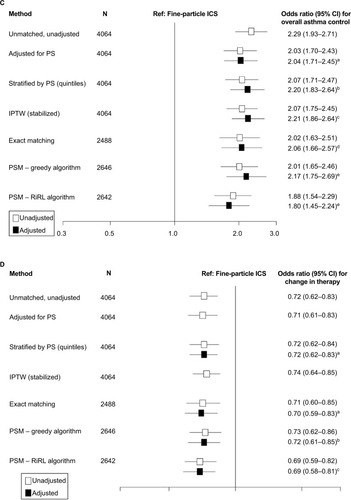
Table 3 Comparative characteristics of causal analysis methods tested for comparison between extrafine ciclesonide and larger fineparticle ICS in real-life patients with asthma from the PHARMO database
Table S1 Correlation coefficients between the propensity score and its components, ranked in order of absolute magnitude
Table S2 Unadjusted results for study endpoints