
Figures & data
Table 1 Baseline patient characteristics
Table 2 Sample sizes and reasons for loss to follow-up by year
Figure 1 Yearly observed stroke rates in matched cohorts. (A) PVA vs matched general AF cohorts; (B) PVA vs matched cardioversion cohorts.
Abbreviations: AF, atrial fibrillation; PVA, pulmonary vein ablation.
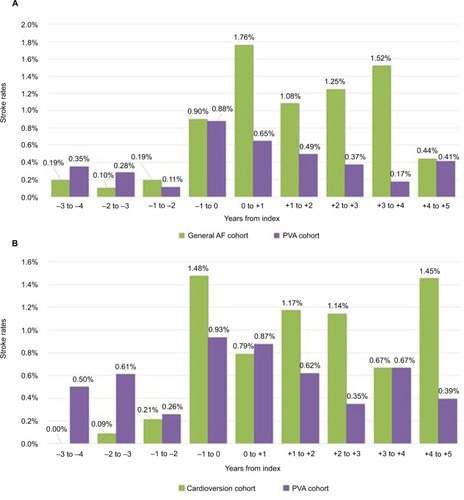
Table 3 Repeated measures logistic regression model resultsTable Footnotea
Table S1 Diagnosis or procedure codes