Figures & data
Table 1 Questionnaire sent to 358 patients at least 6 months postoperatively
Table 2 Demographic-, disease-, and treatment-related variables for the study cohort
Figure 1 Frequency and duration of postoperative dysphagia complaints
Abbreviation: TT, total thyroidectomy.
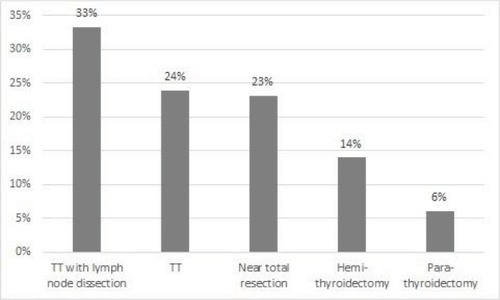
Figure 2 Frequency of dysphagia depending on the operative therapy.
Notes: The more invasive the operation was, the more patients suffered from dysphagia. Dysphagia occurred depending on the operative therapy between 6.1% for parathyroid resection and 33% for total thyroidectomy with lymph node dissection.
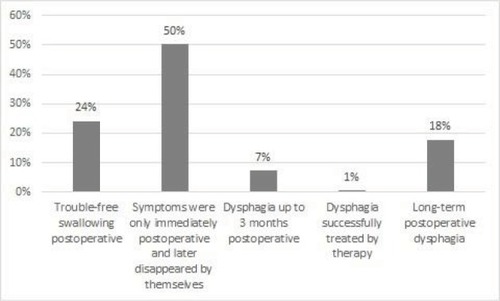
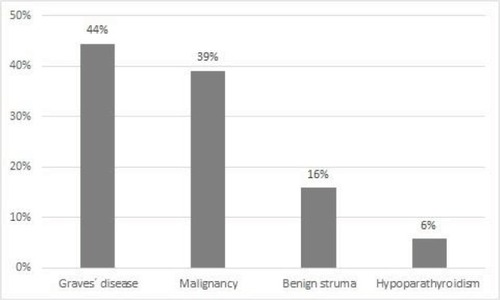
Figure 3 Frequency of dysphagia depending on diagnosis.
Notes: Patients with Graves’ disease and carcinomas showed a significantly higher risk and patients with hyperparathyroidism a significantly lower risk of dysphagia.