
Figures & data
Figure 1 Patient population for the safety and effectiveness analysis.
Abbreviations: CRF, case report form; n, number of patients.
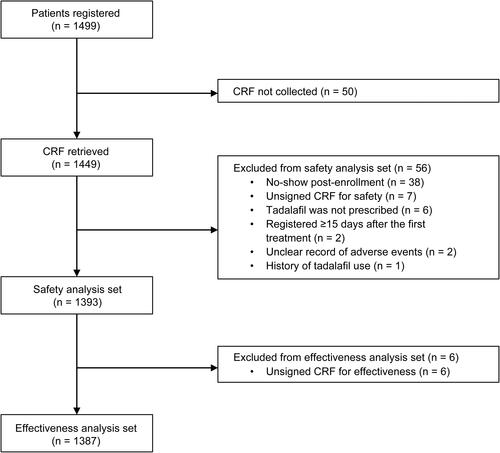
Table 1 Baseline Demographics and Patient Characteristics
Table 2 Patient’s Medical Background
Figure 2 Persistence with treatment during the 18-month observation study (Kaplan–Meier curve). *At 12 months, 4 patients were censored because they had final exposure information and were not considered to have discontinued tadalafil treatment. At 18 months, patients with continuous tadalafil treatment were considered as right-censored.
Abbreviation: CI, confidence interval.
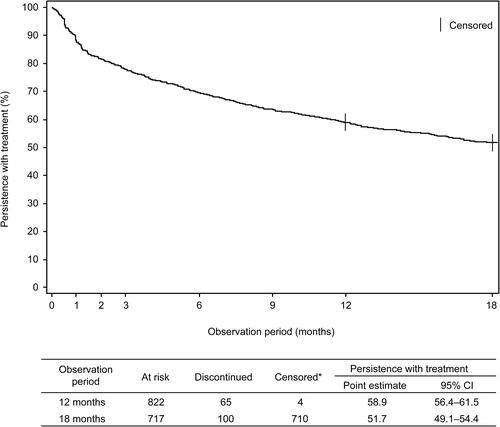
Table 3 Number and Frequency of Adverse Drug Reactions During Tadalafil Treatment
Table 4 Long-Term Safety During Tadalafil Treatment
Table 5 Mean Change from Baseline in Vital Signs During Tadalafil Treatment
Table 6 Effect of Tadalafil on Maximum Urinary Flow Rate and Post-Voiding Residual Urine Volume
Table 7 Effect of Tadalafil on Total IPSS and IPSS-QOL