Figures & data
Table 1 Patient characteristics, ASA indication, and reason for termination of follow-up
Figure 1 Kaplan–Meier survival curves illustrating acetylsalicylic acid discontinuation over the study period, in the whole cohort (A) and according to ASA indication (B).
Abbreviations: ASA, acetylsalicylic acid; CeVD, cerebrovascular disease; IHD, ischemic heart disease; MI, myocardial infarction; UA, unstable angina.
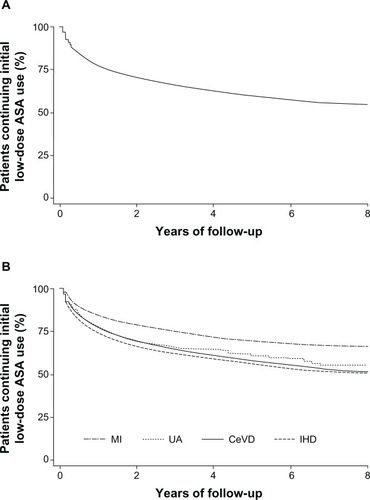
Table 2 Association between patient characteristics and ASA discontinuation risk
Table 3 Association between comorbiditiesTable Footnotea and ASA discontinuation risk
Table 4 Association between concomitant medicationsTable Footnotea and ASA discontinuation risk
Table 5 Association between use of gastroprotective medication since the start of ASA therapyTable Footnotea and discontinuation risk