Figures & data
Table 1 Data on Population Density, Median Age, Social Mandate, and Covid-19 Mortality, and Covid-19 Maximum Mortality Rate on the 27 States in the USA Used in This Analysis. Covid-19 Data Was Obtained from IHME and Census Data.Citation7,Citation9,Citation10
Table 2 Data on Population Density, Median Age, Social Mandate, and Covid-19 Mortality, and Covid-19 Maximum Mortality Rate on the 12 European Countries Used in This Analysis. Covid-19 Data Was Obtained from IHME and Census Data.Citation7,Citation9,Citation10
Table
Table
Figure 1 Standardized Covid-19 peak-mortality-rate (PMR) per European country correlated to days under mandated social distancing directives prior to the peak.
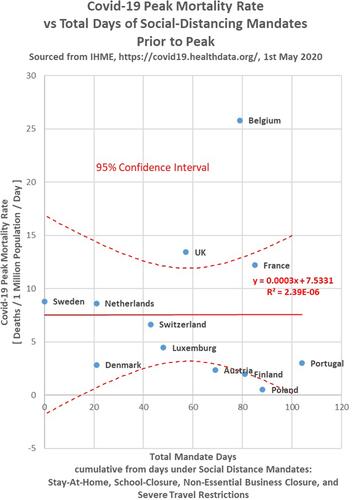
Figure 2 Standardized Covid-19 peak-mortality-rate (PMR) correlated to days under US state-mandated social distancing directives prior to the peak.
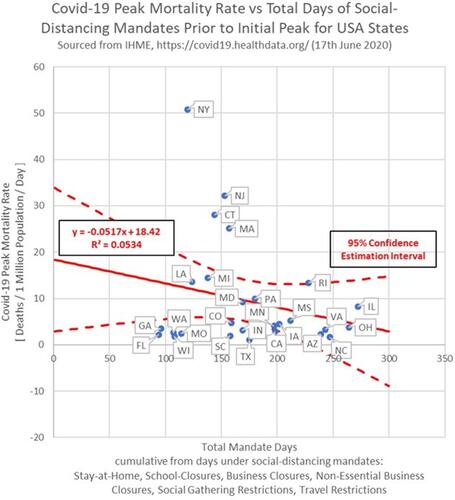
Figure 3 Standardized Covid-19 peak-mortality-rate (PMR) correlated to US state average population density.
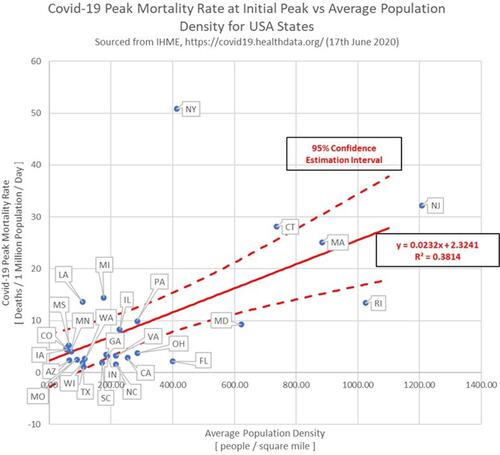
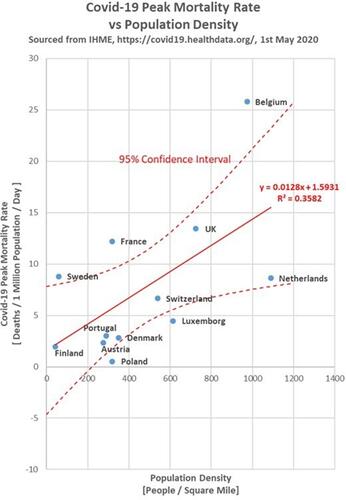
Figure 4 Standardized Covid-19 peak-mortality-rate (PMR) correlated to European country average population density.