Figures & data
Figure 1 Study design.
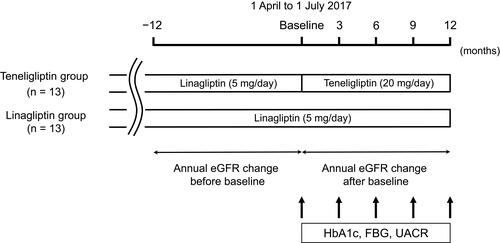
Table 1 Baseline Patient Characteristics
Figure 2 Patient flow diagram.
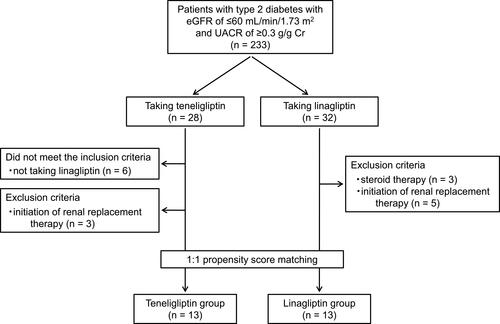
Figure 3 Changes in HbA1c over 12 months following the baseline measurement. (A) Changes in HbA1c in the teneligliptin and linagliptin groups. (B) Changes in HbA1c in the teneligliptin group. Eleven patients were taking 20 mg/day of teneligliptin (thin solid line) and two patients were 40 mg/day (bold solid line). (C) Changes in HbA1c in the linagliptin group.
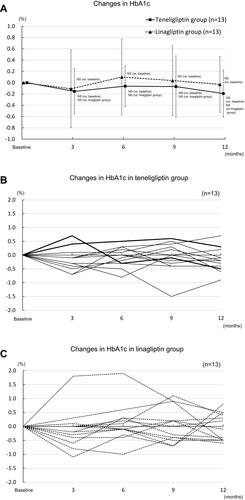
Figure 4 Changes in FBG over 12 months following the baseline measurement. (A) Changes in FBG in the teneligliptin and linagliptin groups. (B) Changes in FBG in the teneligliptin group. Eleven patients were taking 20 mg/day of teneligliptin (thin solid line) and two patients were 40 mg/day (bold solid line). (C) Changes in FBG in the linagliptin group.
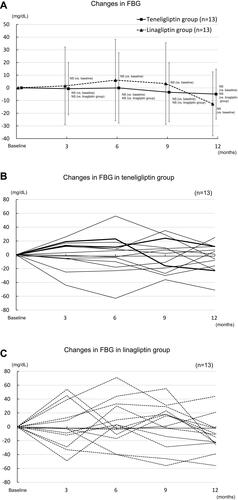
Figure 5 Changes in UACR over 12 months following the baseline measurement. (A) Changes in UACR in the teneligliptin and linagliptin groups. (B) Changes in UACR in the teneligliptin group. Eleven patients were taking 20 mg/day of teneligliptin (thin solid line) and two patients were 40 mg/day (bold solid line). (C) Changes in UACR in the linagliptin group.
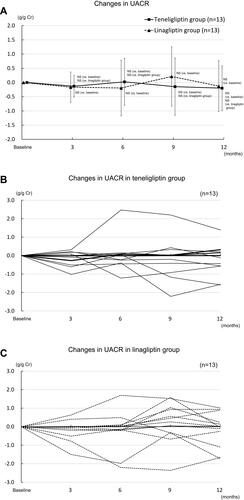
Figure 6 Changes in eGFR over 12 months before and after the baseline measurement. (A) Changes in eGFR in the teneligliptin and linagliptin groups. (B) Changes in eGFR in the teneligliptin group. Eleven patients were taking 20 mg/day of teneligliptin (thin solid line) and two patients were 40 mg/day (bold solid line). (C) Changes in eGFR in the linagliptin group.
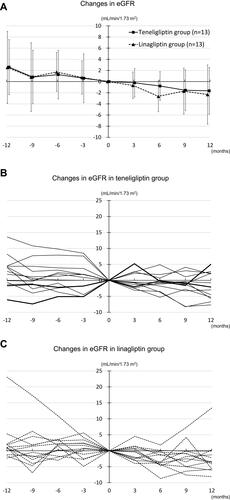
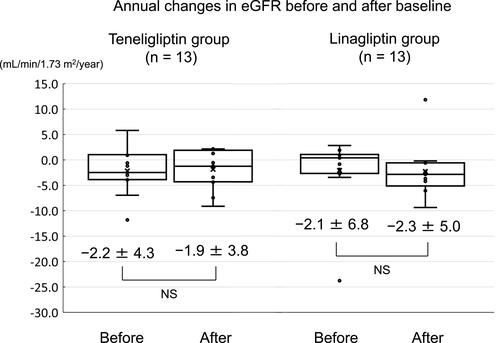
Figure 7 Annual changes in eGFR before and after baseline in the teneligliptin and linagliptin groups.