Figures & data
Table 1 Baseline Characteristics of per Patients in Sweden (Safety Population)
Figure 1 Mean VAS score reduction following MP-AzeFlu use by PER patients in Sweden (N = 161). †p = 0.001 vs Day 0; ‡p < 0.0001 vs Day 0.
Abbreviations: ARIA, Allergic Rhinitis and its Impact on Asthma; MP-AzeFlu, Meda Pharma’s AzeFlu; PER, persistent allergic rhinitis; SEM, standard error of the mean; VAS, visual analogue scale.
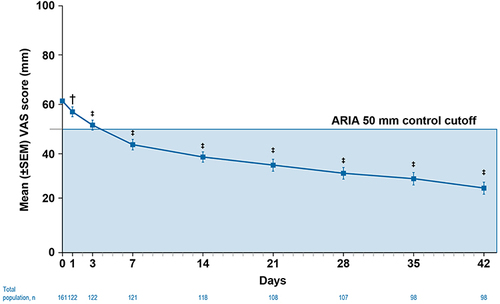
Figure 2 Mean VAS score reduction following MP-AzeFlu use by PER patients in Sweden according to (A) age, (B) sex, (C) baseline disease severity, and (D) AR phenotype.
Abbreviations: AR, allergic rhinitis; ARIA, Allergic Rhinitis and its Impact on Asthma; MP-AzeFlu, Meda Pharma’s AzeFlu; PAR, perennial AR (allergy to ≥1 nonpollen allergen [dust mites, animal dander, and/or mold] but no pollen allergens); PER, persistent AR; SAR, seasonal AR (allergy to ≥1 pollen allergen); SAR and PAR, allergy to ≥1 pollen allergen and ≥1 nonpollen allergen; SEM, standard error of the mean; VAS, visual analogue scale; y, years.
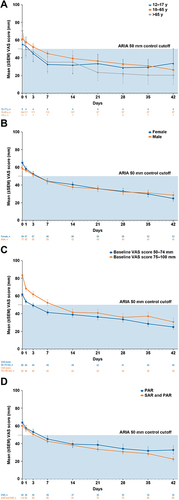
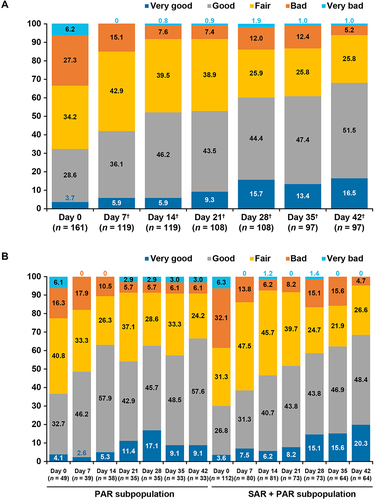
Figure 3 Quality of sleep over time for (A) safety population and (B) AR phenotype subpopulations. †p < 0.001 vs Day 0 (Wilcoxon signed-rank test). Values within each bar may not add up exactly to 100% because of rounding. Missing values are not considered in this figure.
Abbreviations: AR, allergic rhinitis; SAR + PAR, seasonal AR (allergy to ≥1 pollen allergen) and perennial AR (allergy to ≥1 nonpollen allergen).