Figures & data
Figure 1 Derivation and validation of the B3S3 and benchmark algorithm. aHyperparameters were tuned using a 10-fold cross validation procedure in the training set. See eTable 2 for the hyperparameters that were tuned for each algorithm and the final tuned values. The training data (solid grey box) were used to derive two prediction models for pre-operative BMI: 1) a LASSO regression model created through a machine learning pipeline, where a random forest regression model was first used to identify the 15 most important features among all candidate predictors, and then the top 15 features and all 2-way interactions between them were used as inputs into a LASSO regression model (A), and 2) a simple linear regression model utilizing all candidate predictors as inputs without any variable selection or interaction terms (B). The performance of the LASSO model and the simple linear regression model, fit on the full training data, was evaluated in two hold-out sets of the study data not used during training (the concurrent and prospective testing set; hatched grey boxes). The final fitted models were also evaluated in 1000 bootstrap resamples of the 2 testing sets to calculate empirical 95% confidence intervals for all performance metrics (C). The regression coefficients from the fitted LASSO model represent the scores in the B3S3.
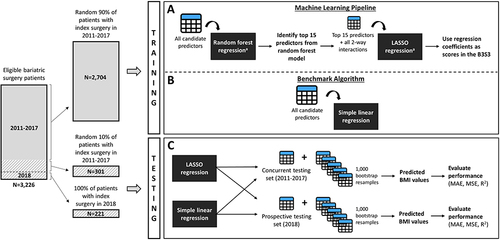
Table 1 Characteristics of the Study Cohort
Table 2 Coefficients of the LASSO Regression Model
Table 3 Performance of the B3S3 and the Simple Linear Regression Model
Table 4 Calibration of the B3S3 and the Simple Linear Regression Model
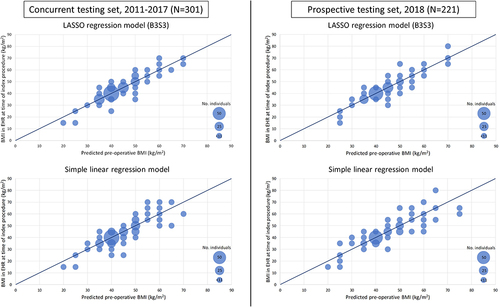
Figure 2 Calibration plots for the B3S3 and the simple linear regression model. The calibration plots show the number of individuals falling within each 5-unit category of observed versus predicted BMI, where the size of the dots is proportional to the number of individuals in the category. Areas of the plot with <11 patients are represented using the same sized dots to maintain the de-identification nature of the database. Perfect calibration occurs along the diagonal line, where the predicted and observed BMI values are equivalent.