
Figures & data
Table 1 Patient Sociodemographic Characteristics
Table 2 Patient Clinical Characteristics
Table 3 Internal Consistency of the SCI
Table 4 Fit Results of the Competing Models Tested (n=100)
Figure 1 Graphical representation of the refined model (Model 3), with standardized values.
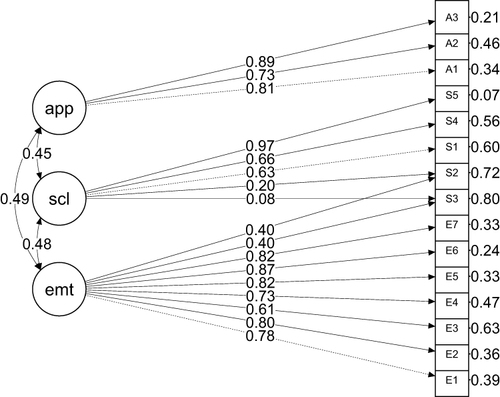
Table 5 Correlations Between the SCI – I Subscales and the Total Score
Table 6 Spearman Correlation Coefficients Between SCI – I and WHO-5-I Scores
Table 7 Spearman Correlation Coefficients Between SCI – I and DLQI Scores
Table 8 Test–Retest Reliability
Table 9 Mean SCI Scores at the 1st, 2nd and 3rd Visits
Table 10 Standardized response mean (SRM)
Table 11 Segment Analysis and SCI Score Differences Across Anatomic Units at the 1st Visit
Table 12 Segment Analysis and SCI Score Differences Across Anatomic Units at the 2nd Visit
Table 13 Segment Analysis and SCI Score Differences Across Anatomic Units at the 3rd Visit
Data Sharing Statement
The data underlying this article will be shared by the corresponding author upon reasonable request.