
Figures & data
Figure 1 Flow diagram of patients.
Note:
*Data missing due to patients not showing up or the nurses being off duty when data should be collected.
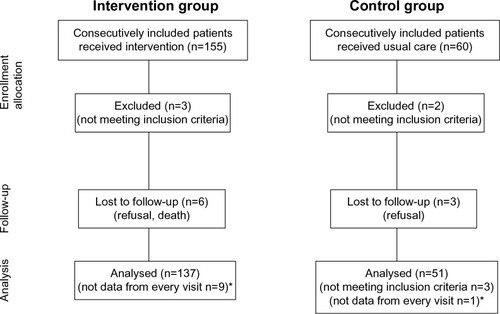
Table 1 Description of every part of patient-centeredness
Table 2 The items of the Satisfaction with Information about Medicine Scale instrument
Table 3 Added questions about where the patient had received information from
Table 4 Overview of the results of the patients’ answers to the Satisfaction with Information about Medicine Scale instrument part 1 (information about the action and usage of medication), part 2 (information about potential problems of medication), and the total of the scores
Table 5 The patients’ answers to where they had received their information about their medicines and how useful the information was at the two year follow-up