
Figures & data
Figure 1 CONSORT diagram of the clinical trial.
Abbreviation: CONSORT, Consolidated Standards or Reporting Trials.
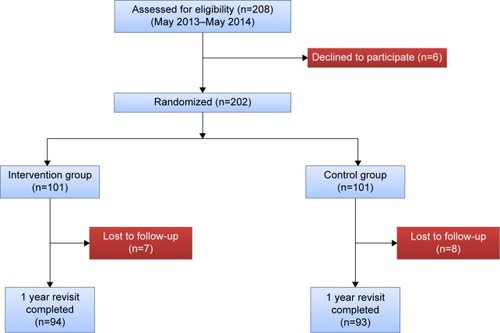
Table 1 Demographic characteristics of the study participants
Table 2 Mean home-exercise times in the control and telephone follow-up groups
Figure 2 Description of the variable scores 12 months after discharge.
Note:
T0 represent “before the operation” and T1, T2, T3 represent 3, 6, 12 months after the operation, respectively.
Abbreviations: SF-36, Short Form-36; PCS, physical component summary; MCS, mental component summary; WOMAC, Western Ontario and McMaster Universities Osteoarthritis Index; BDS, Beck Depression Scale.
Abbreviations: SF-36, Short Form-36; PCS, physical component summary; MCS, mental component summary; WOMAC, Western Ontario and McMaster Universities Osteoarthritis Index; BDS, Beck Depression Scale.
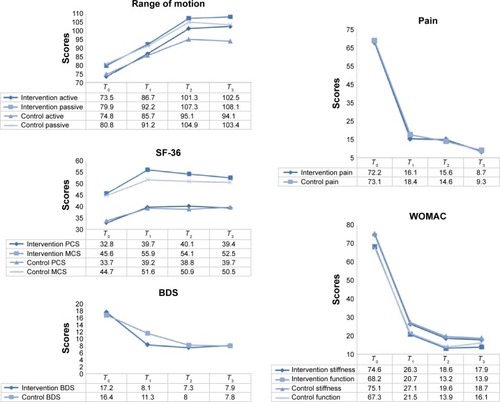
Table 3 Patient-reported outcomes and active ROM before and after TKA
Table 4 Tests of inter-subject effects in a repeated measures analysis of variance