
Figures & data
Figure 1 Flowchart of patient participation.
Abbreviations: CFQ-R, Cystic Fibrosis Questionnaire-Revised; TIP, tobramycin inhalation powder; TSQM, Treatment Satisfaction Questionnaire for Medication.
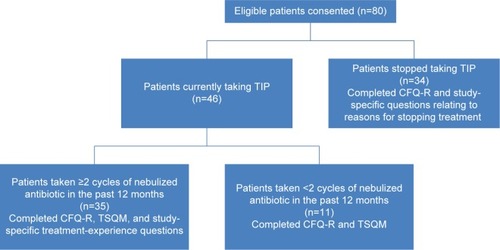
Table 1 Patient baseline sociodemographic and clinical characteristics
Table 2 Preference between TIP and nebulized antibiotic (n=35)
Table 3 Patient priorities for features of inhaled antibiotic treatments
Table 4 OLS regression on TSQM global satisfaction domain scores (n=46)