
Figures & data
Figure 1 Percentage distribution of positive/negative attitude and favorable/unfavorable practice.
Abbreviation: PMS, percentage mean scores.
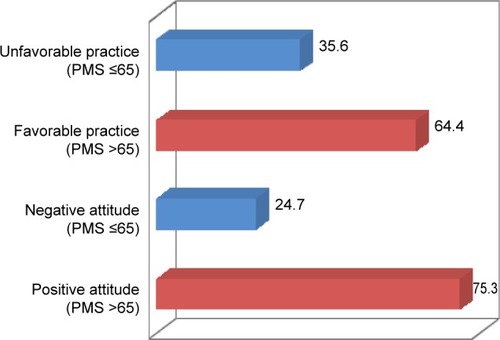
Table 1 Frequency and percentage distribution of physicians’ response to attitude and practice statements
Table 2 Sample characteristics compared by the percentage mean scores of attitude and practice
Table 3 Factors significantly associated with positive attitude and favorable practice