Figures & data
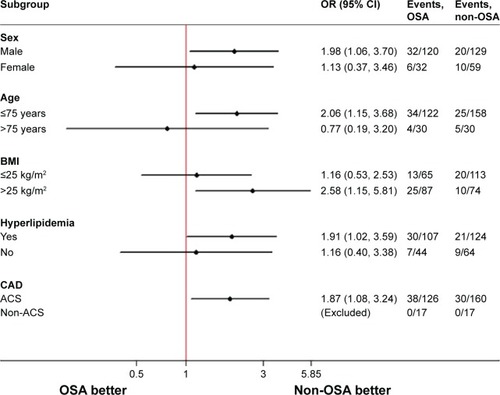
Figure 1 Flowchart of study design.
Abbreviations: CPAP, continuous positive airway pressure; DES, drug-eluting stent; IABP, intra-aortic balloon pump; OSA, obstructive sleep apnea; SBP, systolic blood pressure.
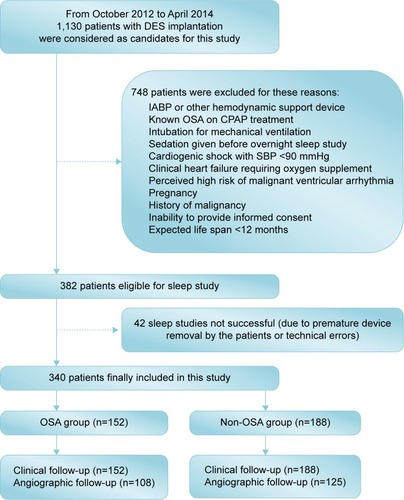
Table 1 Baseline clinical and sleep characteristics of the OSA and non-OSA groups
Table 2 Angiographic and procedural characteristics of the OSA and non-OSA groups
Figure 2 MACE-free survival rate at 2 years.
Note: Freedom from MACEs between the OSA group (red line) and non-OSA group (blue line) at 2-year follow-up.
Abbreviations: MACEs, major adverse cardiac events; OSA, obstructive sleep apnea.
Abbreviations: MACEs, major adverse cardiac events; OSA, obstructive sleep apnea.
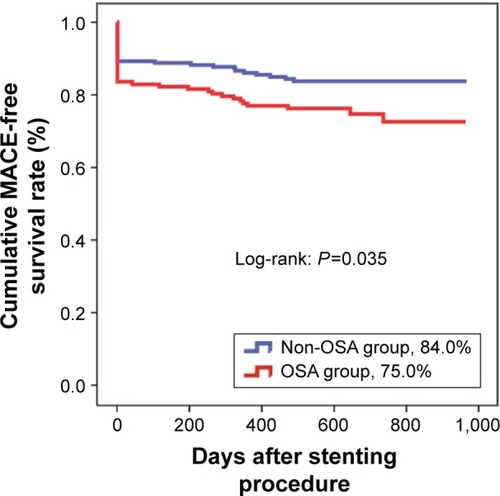
Table 3 Clinical outcomes in the OSA and non-OSA groups
Table 4 Univariate and multivariate analyses for MACEs
Table 5 Quantitative coronary analysis of the OSA and non-OSA groups
Figure 3 Forest plots of 2-year MACE rate in the prespecified subgroups.
Note: Data in the Events columns presented as number of events/total number of patients.
Abbreviations: ACS, acute coronary syndrome; BMI, body mass index; CAD, coronary artery disease; CI, confidence interval; MACEs, major adverse cardiac events; OR, odds ratio; OSA, obstructive sleep apnea.
Abbreviations: ACS, acute coronary syndrome; BMI, body mass index; CAD, coronary artery disease; CI, confidence interval; MACEs, major adverse cardiac events; OR, odds ratio; OSA, obstructive sleep apnea.